. 2009 Oct;297(4):R940-9.
doi: 10.1152/ajpregu.00358.2009. Epub 2009 Jul 22.

Sustained stimulation of vasopressin and oxytocin release by ATP and phenylephrine requires recruitment of desensitization-resistant P2X purinergic receptors

Affiliations

Sustained stimulation of vasopressin and oxytocin release by ATP and phenylephrine requires recruitment of desensitization-resistant P2X purinergic receptors

Dayane A Gomes et al. Am J Physiol Regul Integr Comp Physiol. 2009 Oct.

Abstract

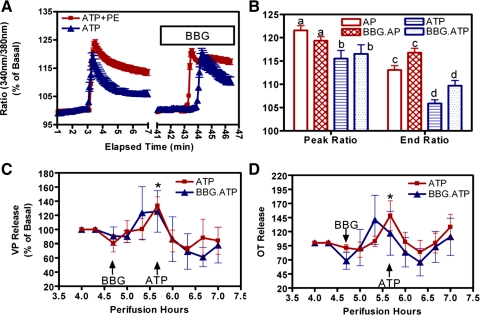
Coexposure of hypothalamo-neurohypophyseal system explants to ATP and phenylephrine [PE; an alpha1-adrenergic receptor (alpha1-AR) agonist] induces an extended elevation in vasopressin and oxytocin (VP/OT) release. New evidence is presented that this extended response is mediated by recruitment of desensitization-resistant ionotropic purinergic receptor subtypes (P2X-Rs): 1) Antagonists of the P2X2/3 and P2X7-Rs truncated the sustained VP/OT release induced by ATP+PE but did not alter the transient response to ATP alone. 2) The P2X2/3 and P2X7-R antagonists did not alter either ATP or ATP+PE-induced increases in [Ca(2+)](i). 3) P2X2/3 and P2X7-R agonists failed to elevate [Ca(2+)](i), while ATP-gamma-S, an agonist for P2X2-Rs increased [Ca(2+)](i) and induced a transient increase in VP/OT release. 4) A P2Y1-R antagonist did not prevent initiation of the synergistic, sustained stimulation of VP/OT release by ATP+PE but did reduce its duration. Thus, the desensitization-resistant P2X2/3 and P2X7-R subtypes are required for the sustained, synergistic hormone response to ATP+PE, while P2X2-Rs are responsible for the initial activation of Ca(2+)-influx by ATP and ATP stimulation of VP/OT release. Immunohistochemistry, coimmunoprecipitation, and Western blot analysis confirmed the presence of P2X2 and P2X3, P2X2/3, and P2X7-R protein, respectively in SON. These findings support the hypothesis that concurrent activation of P2X2-R and alpha1-AR induces calcium-driven recruitment of P2X2/3 and 7-Rs, allowing sustained activation of a homeostatic circuit. Recruitment of these receptors may provide sustained release of VP during dehydration and may be important for preventing hemorrhagic and septic shock.


Figures

Fig. 1.
Fig. 1.
Effect of ATP-γ-S, an agonist at P2X1, 2, 3, and 4-Rs, on [Ca2+]i in supraoptic nuclei (SON) neurons filled with fura-2 AM. A: time course of the response to ATP-γ-S (100 μM) followed after a 30-min washout by ATP (100 μM) in SON neurons simultaneously recorded in a single hypothalamo neurohypophyseal system (HNS) explant preparation (means ± SE, n = 20). Both ATP-γ-S and ATP induced rapid increases in [Ca2+]i, as monitored by the change in 340:380 emission ratio, which returned toward baseline prior to washout of the ligand. B: comparison of the peak 340/380 ratios induced by ATP-γ-S and ATP in 36 neurons combined from 2 HNS preparations (means ± SE). The peak response to ATP was significantly greater than that elicited by ATP-γ-S (*P < 0.001) This is consistent with ATP activation of both P2X and P2Y-Rs (39). The y-axis in B is the same as in A. C: immunohistochemistry for P2X2-R in rat SON (C) and PVN (C′). Note the intense labeling of the cytoplasm throughout the dorsal/ventral extent of SON and in both magnocellular (mc) and parvocellular (pc) neurons in PVN. The P2X2-R immunoreactivity was eliminated by preincubation of the antibody with the peptide antigen (not shown). Scale bars: 100 μm. OC, optic chiasm; VGL, ventral glia lamina.
Fig. 2.
Fig. 2.
Effect of a P2X3 and 2/3-R selective agonist, (α,βMeATP; 100 μM) and antagonist (A317491; 300 nM) on [Ca2+]i, and ATP-induced vasopressin/oxytocin (VP/OT) release. A: time course of the [Ca2+]i response to α,βMeATP followed by ATP (100 μM). B: mean peak response to ATP was significantly greater than that to α,βMeATP (n = 38 neurons in 2 explants, H = 56.26, P < 0.001). C: time course of the change in [Ca2+]i in response to ATP (blue trace) or ATP+PE (red trace; each at 100 μM) alone or in the presence of A317491 (300 nM). D: analysis of the peak and sustained elevations in [Ca2+]i induced by exposure to ATP or ATP+PE in the presence or absence of A317491. Data from two explants for each treatment are combined (n = 36 neurons for ATP, 22 for ATP+PE). All neurons analyzed responded. As reported previously, the peak response was comparable to ATP or ATP+PE (40), and it was not altered by A317491 (F = 1.8, P = 0.15). The sustained elevation in [Ca2+]i induced by ATP+PE was greater than that to ATP alone [H = 43.398, P < 0.001] (40), but it was not altered by A317491 (P > 0.05 b vs. c, end ratio). Values are expressed as means ± SE; bars labeled with the same letter indicate no significant difference from each other. The y-axis in D is the same as in C. ATP induced a transient increase in VP and OT release (E and F: *P < 0.05 vs. other times between 5 and 7 h) that was not altered by the prior addition of A317491 (300 nM, A31.ATP; E: VP: Ftime = 6.29, P < 0.001, Fgroup = 0.8, P = 0.4; F: OT: Ftime =3.4, P = 0.005; Fgroup = 0.001, P = 0.9; n = 6/group). Arrows indicate the time that agonists/antagonists reached the explants. The drugs were present during the remainder of the experiment. Note that the small decrease in VP/OT release observed in response to A317491 alone was not statistically different from that in unexposed explants (ATP group from hour 4.5 to 5.5).
Fig. 3.
Fig. 3.
Effect of A317491 (300 nM; a P2X2/3 antagonist) and Brilliant Blue G (BBG; 1 μM; a selective P2X7-R antagonist) on ATP+PE stimulated VP/OT release from HNS explants. A and A′: Following equilibration, all explants were exposed to ATP+PE for the rest of experiment. Two hours later, A317491 (A317491.AP, n = 6) or BBG (BBG.AP, n = 5) was added to the perifusion medium. Both VP and OT release increased during exposure to ATP+PE (P = 0.028, VP; P < 0.001, OT). Both A317491 and BBG reduced VP/OT release relative to the group maintained with ATP+PE alone (n = 5; F = 1.9, P = 0.01 for VP; F = 3.5, P < 0.001 for OT; individual mean comparisons: *P ≤ 0.04 both drug groups vs. ATP+PE alone; #P = 0.04 BBG.AP vs. ATP+PE only). B and B′: A317491 (n = 6) and BBG (n = 5) were added 1 h before ATP+PE and remained in the perifusion medium for the rest of the experiment. Control explants (n = 5) were perifused with basal medium throughout the experiment. In the absence of either antagonist, ATP+PE (n = 6) induced a significant increase in VP/OT release compared with the control (F = 14.9, P < 0.001 for VP; F = 6.8, P = 0.018 for OT; *Individual mean comparisons P ≤ 0.05), but neither VP nor OT release was significantly different from controls in the A317491.AP or BBG.AP groups following the addition of ATP+PE. Neither drug significantly altered basal VP or OT release (an hour prior to ATP+PE addition).
Fig. 4.
Fig. 4.
Effect of BBG on [Ca2+]i and ATP-induced VP/OT release. A: time course of the [Ca2+]i response to ATP (100 μM; blue trace) or ATP+PE (100 μM each; red trace) alone or in the presence of BBG (1 μM). B: analysis of the peak and sustained elevations in [Ca2+]i induced by exposure to ATP or ATP+PE in the presence or absence of BBG. Data combined from two explants/treatment (n = 24 neurons for ATP, 36 for ATP+PE). All neurons that were analyzed responded. The peak response was not altered by BBG. Again, ATP+PE induced a sustained elevation in [Ca2+]i compared with ATP alone (P < 0.05 C vs. D, end ratio) that was not altered by BBG. Values are expressed as means ± SE; labels with the same letter are not significantly different from each other. The y-axis label in B is the same as in A. C and D: ATP induced a transient increase in VP and OT release (*P < 0.05 vs. hours 5 and 6) that was not altered by the prior addition of BBG (VP: Ftime = 5.09, P < 0.001, Fgroup = 0.12, P = 0.7; F: OT: Ftime = 4.43, P < 0.001; Fgroup = 0.22, P = 0.6; n = 5/group). Basal VP and OT release was not significantly different in the presence of BBG during the hour before ATP addition.
Fig. 5.
Fig. 5.
BzATP effect on [Ca2+]i. A: time course of the [Ca2+]i response to BzATP (20 μM followed by 100 μM) and subsequently ATP (100 μM). Values are means ± SE from 18 neurons in one hypothalamo-neurohypophyseal system (HNS) explant. B: peak change in 340:380 ratio was significantly greater in response to 100 μM compared with 20 μM BzATP (*P < 0.05). The response to ATP was significantly greater than the response to 100 μM BzATP (#P < 0.05). C: peak response to 200 μM BzATP (BzATP 200) was comparable to the response to ATP-γ-S and significantly less than the response to 100 μM ATP (*P < 0.001).
Fig. 6.
Fig. 6.
Molecular evidence for the presence of P2X2/3-R in SON. A: Coimmunoprecipitation of P2X2 and P2X3. The Western blot, reacted with anti-P2X2-R, reveals immunoreactive protein bands of the appropriate size for P2X2-R in microdissected rat SON homogenized in co-IP buffer (SON lane) and in the elution fraction of SON tissue immunoprecipitated with anti-P2X3-R (X3-IP lane). No immunoreactive band was present in the elution fraction from anti-P2X3 Sepharose beads when SON protein was omitted (IP-cont. lane). Size markers are indicated in left lane. B: immunohistochemistry for P2X3-R in rat SON. Scale bar: 100 μm. B′: digital magnification of the area denoted by the dashed box in B. Note the primarily cytoplasmic location of the immunoreactivity throughout the dorsal/ventral extent of SON. Immunoreactivity was eliminated by omission of the primary antibody (not shown).
Fig. 7.
Fig. 7.
P2X7-immunoreactive protein is present in SON from rat (rSON) and wild-type mouse (WTson), but not P2X7 knockout mouse (X7KOson). The 75-kDa protein band reported by others is present in all lanes, but the ∼70 kDa P2X7-ir protein that is present in rat and wild-type mouse SON is absent in the P2X7-KO mouse. Preincubation of the P2X7 antibody with antigen peptide eliminated all bands.
Fig. 8.
Fig. 8.
Effect of calmidazolium on the sustained stimulation of VP and OT release by ATP+PE. Calmidazolium (Cal, 10 or 100 μM), an antagonist that blocks P2X7-R ion conductance, but not P2X7-R pore formation, was added 2 h after the addition of ATP+PE (100 μM each) to perifused HNS explants. ATP+PE increased VP (A) and OT (B) release relative to control explants (F = 5.1, P = 0.009 for VP; F = 4.5, P = 0.035 for OT). Both VP and OT release remained elevated in the presence of calmidazolium [VP: *P < 0.05, ATP+PE (n = 9) and calmidazolium 10 μM.AP (n = 3) vs. control (n = 6); #P < 0.05, calmidazolium 100 μM.AP (n = 4) vs. control; OT: *P < 0.05 calmidazolium100.AP (n = 5) vs. control (n = 5); #P < 0.05 ATP+PE (n = 5) vs. control].
Fig. 9.
Fig. 9.
Effect of MRS2179 (100 μM), a P2Y1-R antagonist, on VP and OT release induced by combined exposure to ATP+PE (100 μM each). A: VP release was significantly elevated by ATP+PE (P < 0.001). The presence of MRS2179 (MRS+AP) did not alter this response during the first 2 h (*P < 0.05 for ATP+PE and MRS2179+AP vs. control), but subsequently, the response decayed in the MRS2179+AP group, such that MRS2179+AP differed statistically from the both ATP+PE and control ($) and then was not different from control, while ATP+PE remained significantly greater than control (#P < 0.01). B: OT release initially was significantly elevated in both the ATP+PE and MRS2179+AP groups (*P < 0.001 for ATP+PE and MRS+AP vs. control) but then decreased precipitously leaving only the ATP+PE group greater than control (#P = 0.01, 0.055, 0.045, and 0.051 at the next 4 respective time points).

Similar articles

Cited by

References

    1. Berridge CW, Waterhouse BD. The locus coeruleus-noradrenergic system: modulation of behavioral state and state-dependent cognitive processes. Brain Res Brain Res Rev 42: 33–84, 2003 - PubMed
    1. Bianchi BR, Lynch KJ, Touma E, Niforatos W, Burgard EC, Alexander KM, Park HS, Yu H, Metzger R, Kowaluk E, Jarvis MF, van Biesen T. Pharmacological characterization of recombinant human and rat P2X receptor subtypes. Eur J Pharmacol 376: 127–138, 1999 - PubMed
    1. Blair ML, Mickelsen D. Plasma protein and blood volume restitution after hemorrhage in conscious pregnant and ovarian steroid-replaced rats. Am J Physiol Regul Integr Comp Physiol 290: R425–R434, 2006 - PubMed
    1. Boue-Grabot E, Archambault V, Seguela P. A protein kinase C site highly conserved in P2X subunits controls the desensitization kinetics of P2X2 ATP-gated channels. J Biol Chem 275: 10190–10195, 2000 - PubMed
    1. Buell G, Michel AD, Lewis C, Collo G, Humphrey PP, Surprenant A. P2X1 receptor activation in HL60 cells. Blood 87: 2659–2664, 1996 - PubMed

Publication types

MeSH terms