. 2009 Oct 8;114(15):3299-308.
doi: 10.1182/blood-2008-07-170282. Epub 2009 Jul 22.

The preferentially expressed antigen in melanoma (PRAME) inhibits myeloid differentiation in normal hematopoietic and leukemic progenitor cells

Affiliations

The preferentially expressed antigen in melanoma (PRAME) inhibits myeloid differentiation in normal hematopoietic and leukemic progenitor cells

Vivian G Oehler et al. Blood. .

Abstract

The preferentially expressed antigen in melanoma (PRAME) is expressed in several hematologic malignancies, but either is not expressed or is expressed at only low levels in normal hematopoietic cells, making it a target for cancer therapy. PRAME is a tumor-associated antigen and has been described as a corepressor of retinoic acid signaling in solid tumor cells, but its function in hematopoietic cells is unknown. PRAME mRNA expression increased with chronic myeloid leukemia (CML) disease progression and its detection in late chronic-phase CML patients before tyrosine kinase inhibitor therapy was associated with poorer therapeutic responses and ABL tyrosine kinase domain point mutations. In leukemia cell lines, PRAME protein expression inhibited granulocytic differentiation only in cell lines that differentiate along this lineage after all-trans retinoic acid (ATRA) exposure. Forced PRAME expression in normal hematopoietic progenitors, however, inhibited myeloid differentiation both in the presence and absence of ATRA, and this phenotype was reversed when PRAME was silenced in primary CML progenitors. These observations suggest that PRAME inhibits myeloid differentiation in certain myeloid leukemias, and that its function in these cells is lineage and phenotype dependent. Lastly, these observations suggest that PRAME is a target for both prognostic and therapeutic applications.


Figures

Figure 1
Figure 1
PRAME expression in leukemia cell lines and patient samples. (A) PRAME expression increases with CML disease progression. PRAME expression is shown as the log10 ratio of the normalized expression of PRAME in each patient sample compared with PRAME expression in a pool of CML CP samples. Red bars represent CP patients (n = 42); green bars represent patients with either AP disease by virtue of additional cytogenetic abnormalities (cAP; n = 7) or patients who returned to CP after treatment for BC disease (last 3); dark blue bars represent patients with AP disease by both cytogenetic and blast count criteria (n = 10); and light blue represents BC patients (n = 28). The difference between CP and BC is statistically significant (P << .001). (B) PRAME expression in normal and malignant hematopoietic cells. Normalized PRAME expression is shown on a log2 scale. PRAME was heterogeneously expressed in acute myeloid leukemia (AML) and myelodysplastic syndrome (MDS) patients with either refractory anemia with excess blasts or refractory anemia with excess blasts in transition. From left to right: CD34+ selected bone marrow (BM; red, n = 8), CD34+ selected peripheral blood stem cell products (light green, n = 10), unsorted BM (medium blue, n = 10), unsorted peripheral blood (light blue, n = 10), MDS (brown, n = 29), AML (green, n = 26), CP CML (purple, n = 17 independent cases from those shown in A), B-ALL (medium blue, n = 32), and T-ALL (pink, n = 7). (C) Quantitative PCR validation of PRAME expression in independent diagnostic BM samples from BC (n = 31) and early CP (n = 58) CML patients demonstrates increased expression in BC. Data are shown on a logarithmic (log10) scale. The line within each box represents the median; the upper and lower lines defining the box represent the 75th and 25th percentiles, respectively; and the lines outside the box extend to the maximum and minimum values (10−1 indicates undetectable PRAME expression). PRAME was expressed in all but 1 BC patient and in 50% of the CP patients. Mean expression was 9.0 × 10⁴ copies (median, 5.5 × 10⁴; range, 0 to 1.6 × 10⁶ copies) in BC patients versus 560 copies (median, 200; range, 0 to 9.8 × 10³ copies) in CP patients (P < .001).
Figure 2
Figure 2
PRAME expression in all-trans retinoic acid–responsive leukemia cell lines increases proliferation and inhibits granulocytic differentiation. (A) PRAME protein expression is shown in HL60, NB4, and K562 cells by Western blotting. PRAME protein overexpression by lentiviral PRAME expression vector transduction is shown in total cell lysates (T) from HL60 cells and in both cytoplasmic (C) and nuclear (N) lysates from NB4 cells. PRAME silencing using lentiviral vectors containing short-hairpins targeting PRAME is shown in T-cell lysates in HL60 cells and N lysates in K562 cells. In the HL60 cells shown here, PRAME was silenced in HL60 cells overexpressing PRAME protein. Lamin served as the nuclear control; beta actin and GAPDH served as the cytoplasmic or total lysate control. (B) PRAME-overexpressing HL60 cells (PRAME) proliferated more rapidly than control cells (Control) over 96 hours. When PRAME was silenced in these PRAME-overexpressing cells (shPRAME), proliferation decreased compared with control cells (shControl). PRAME cells are PRAME-overexpressing cells; control cells are the empty vector control. PRAME was silenced (shPRAME) in both PRAME-overexpressing cells and the corresponding empty vector–transduced cells. shControl is a hairpin that targets GFP. (C) The increase in proliferation in HL60 PRAME cells relative to control cells (P < .001) as well as the decrease in proliferation of shPRAME HL60 cells relative to shControl HL60 cells (P = .06 in PRAME-overexpressing cells and P < .001 in control HL60 cells) were seen both in the absence and presence of increasing concentrations of all-trans retinoic acid (ATRA). For simplicity, proliferation in PRAME or shPRAME cells is shown relative to the corresponding control cell line (experimental condition/control condition). Thus, the line at 1.00 indicates the expected ratio if there is no difference. Data at 96 hours are used and show the mean of 3 independent experiments. The P values, however, were calculated using all data (ATRA and no ATRA) at 0, 24, 48, 72, and 96 hours. (D) Granulocytic differentiation as measured by CD11b expression over time was inhibited in PRAME-overexpressing HL60 cells. PRAME cells expressed significantly less CD11b over time than control cells at various ATRA concentrations (P = .003). When PRAME was silenced in these PRAME-overexpressing cells as well as the empty vector control cells, CD11b expression was greater in shPRAME cells compared with shControl cells in both the PRAME-overexpressing cell line and the control vector cell line (P < .001 for both). The ratio of CD11b expression in PRAME or shPRAME cells is shown relative to CD11b expression in control or shControl cells (experimental percentages CD11b/control percentage CD11b) after 96 hours. The line at 1.00 indicates the expected ratio if there is no difference.
Figure 3
Figure 3
Aberrant PRAME expression in CD34+ normal hematopoietic progenitors inhibits myeloid differentiation. (A-C) The numbers of cells in culture expressing CD34 (A), CD117 (B), and CD11b (C) are shown over time in PRAME vector–transduced cells compared with control vector–transduced cells in the absence of ATRA. The data shown represent the mean of 3 independent experiments. On day 0 there were 100 000 cells in culture for each condition. The early precursor cell markers, CD34 and CD117 (P = .001 and P = .002, respectively), were more highly expressed in PRAME cells and the terminal myeloid marker, CD11b (P = .04), demonstrated lower expression in PRAME cells compared with control vector–transduced cells over time. (D-I) The consequences of ATRA exposure on percentage of CD117 and CD11b expression over time are shown. In the absence of ATRA, PRAME-expressing cells, compared with control cells, exhibited up to 41% greater expression of CD117 and 35% lower expression of CD11b (D,G). These differences persisted in PRAME cells exposed to low (physiologic) concentrations of ATRA (0.001 μM; E,H), but were overcome with increasing concentrations of ATRA of 0.01 μM (F,I; CD117 [P = .02] and CD11b [P = .15]). However, as shown in panel F, PRAME cells expressed increased CD117 early in culture between days 0 and 7, compared with later in culture for cells exposed to no ATRA or 0.001 μM ATRA concentrations (D-E).
Figure 4
Figure 4
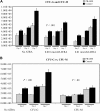
Aberrant PRAME expression in CD34+ hematopoietic progenitors inhibits colony formation due to impaired myeloid differentiation. (A) The numbers of CFU-G and CFU-M in PRAME-transduced cells were compared with control vector–transduced cells. The mean colony numbers from 3 independent experiments performed in triplicate are shown. Colony numbers in PRAME-expressing cells compared with control cells were decreased on days 2, 4, and 7 both in the absence and presence of increasing concentrations of ATRA (P < .001). The numbers on the y-axis represent the numbers of progenitor cells in culture on each experimental day that gave rise to a colony. These numbers were calculated from the colony counts, the numbers of cells in culture on the day of plating, and the numbers of cells plated. (B) To more fully characterize the impact of aberrant PRAME expression on myeloid differentiation, individual colonies were plucked and stained to discriminate CFU-G from CFU-M. There were significantly fewer CFU-G colonies in PRAME cells compared with control cells on days 2, 4, and 7 (P < .001). These differences were not observed for CFU-Ms (P = .88).
Figure 5
Figure 5
PRAME silencing in primary CML progenitor cells increases myeloid colony formation. (A) shPRAME-transduced cells (left) compared with shControl cells (shGFP, right) from 3 CML blast crisis patients exhibited increased colony formation on agarose both in the absence and presence of ATRA at 0.01 and 0.1 μM. Colonies arising from shPRAME and shControl cells exposed to 0.01 μM ATRA from 1 patient are shown. (B) To confirm colony morphology after exposure to GM-CSF and G-CSF individual colonies (i) were plucked and stained with Wright-Giemsa. Colony types were predominately granulocytic (CFU-G, ii) or monocytic (CFU-M, iii), but CFU-GMs (iv) were also seen. (C) shPRAME silenced CML cells compared with shControl cells from 3 patients demonstrated increased numbers of CFU-GMs, CFU-Gs, and CFU-Ms on days 0 and 2. The mean colony numbers from independent experiments performed in triplicate are shown. The numbers represented on the y-axis indicate the numbers of progenitor cells in culture on each experimental day that gave rise to a colony. (D) For 2 patients, sufficient cells were available to assess CFU formation after exposure to ATRA at 0.01 μM and 0.1 μM. Similar to the phenotype seen in the absence of ATRA, shPRAME cells compared with shControl cells formed increased numbers of CFU-GM, CFU-G, and CFU-M colonies. Day 2 is shown; day 4 shows the same increase in CFUs in shPRAME cells compared with shControl cells (included in calculations of statistical significance). Furthermore, the same differences were observed in 1 patient whose cells were treated with 0.001 μM ATRA. The mean numbers of colonies are shown from independent experiments performed in triplicate. The numbers represented on the y-axis indicate the numbers of cells in culture on a particular experimental day that gave rise to a colony.

Similar articles

Cited by

References

    1. Ikeda H, Lethe B, Lehmann F, et al. Characterization of an antigen that is recognized on a melanoma showing partial HLA loss by CTL expressing an NK inhibitory receptor. Immunity. 1997;6(2):199–208. - PubMed
    1. Radich JP, Dai H, Mao M, et al. Gene expression changes associated with progression and response in chronic myeloid leukemia. Proc Natl Acad Sci U S A. 2006;103(8):2794–2799. - PMC - PubMed
    1. van Baren N, Chambost H, Ferrant A, et al. PRAME, a gene encoding an antigen recognized on a human melanoma by cytolytic T cells, is expressed in acute leukaemia cells. Br J Haematol. 1998;102(5):1376–1379. - PubMed
    1. Steinbach D, Hermann J, Viehmann S, Zintl F, Gruhn B. Clinical implications of PRAME gene expression in childhood acute myeloid leukemia. Cancer Genet Cytogenet. 2002;133(2):118–123. - PubMed
    1. Epping MT, Wang L, Edel MJ, Carlee L, Hernandez M, Bernards R. The human tumor antigen PRAME is a dominant repressor of retinoic acid receptor signaling. Cell. 2005;122(6):835–847. - PubMed

Publication types

MeSH terms