

Bioavailability of gallic acid and catechins from grape seed polyphenol extract is improved by repeated dosing in rats: implications for treatment in Alzheimer's disease
- PMID: 19625746
- PMCID: PMC2801429
- DOI: 10.3233/JAD-2009-1135
Bioavailability of gallic acid and catechins from grape seed polyphenol extract is improved by repeated dosing in rats: implications for treatment in Alzheimer's disease
Abstract
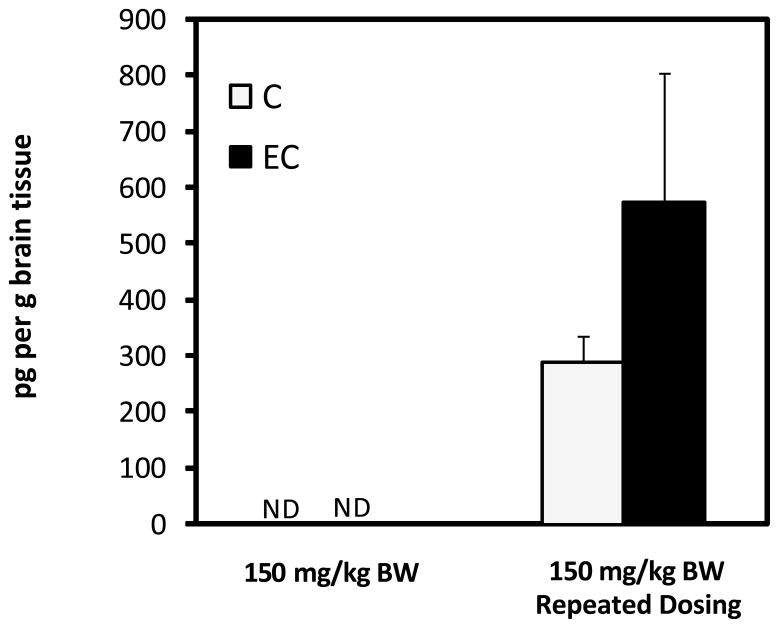
The present study explored the bioavailability and brain deposition of a grape seed polyphenolic extract (GSPE) previously found to attenuate cognitive deterioration in a mouse model of Alzheimer's disease (AD). Plasma pharmacokinetic response of major GSPE phenolic components was measured following intragastric gavage of 50, 100, and 150 mg GSPE per kg body weight. Liquid chromatography-mass spectrometry (LC-MS) analysis identified gallic acid (GA), catechin (C), and epicatechin (EC) in plasma of rats gavaged acutely with GSPE. Additionally, 4-methylgallic acid (4-OMeGA), 3'-methylcatechin (3'-OMeC), and 3'-methylepicatechin (3'-OMeEC) were identified as circulating metabolites of GSPE phenolic constituents. Cmax for individual GSPE constituents and their metabolites increased in a dose-dependent fashion (with increasing GSPE oral dose). Repeated daily exposure to GSPE was found to significantly increase bioavailability (defined as plasma AUC0-8h) of GA, C, and EC by 198, 253, and 282% relative to animals receiving only a single acute GSPE dose. EC and C were not detectable in brain tissues of rats receiving a single GSPE dose but reached levels of 290.7 +/-45.9 and 576.7 +/- 227.7 pg/g in brain tissues from rats administered GSPE for 10 days. This study suggests that brain deposition of GA, C, and EC is affected by repeated dosing of GSPE.
Figures
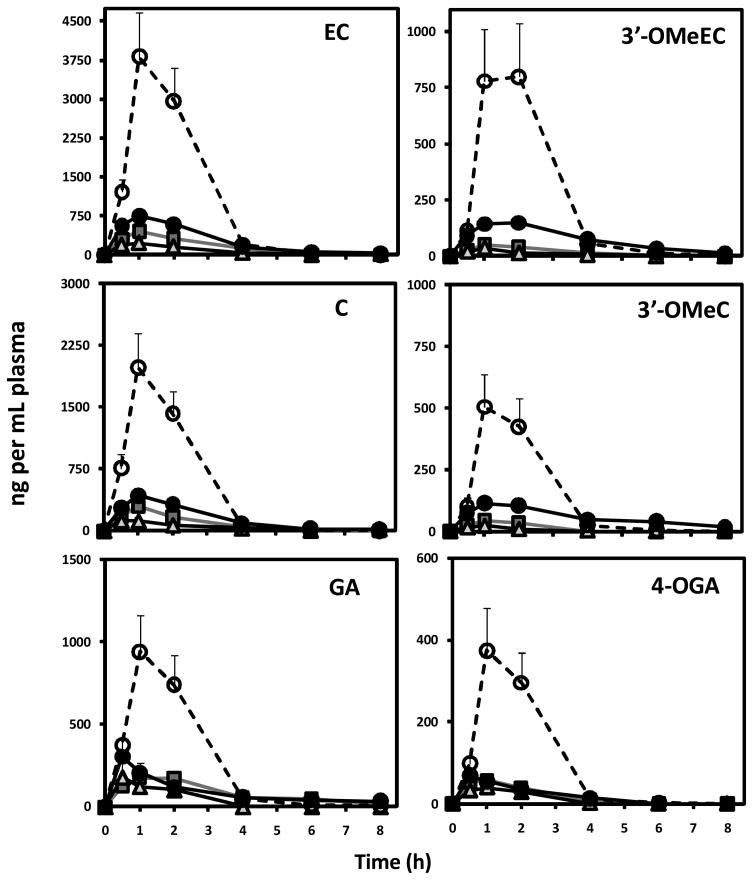
 ) 50, (
 ) 100 and 150 mg GSPE per kg BW (●) before and (○) after pre-treatment with dose-escalation of GSPE. Data represents mean ± SEM n=8 rats per group.
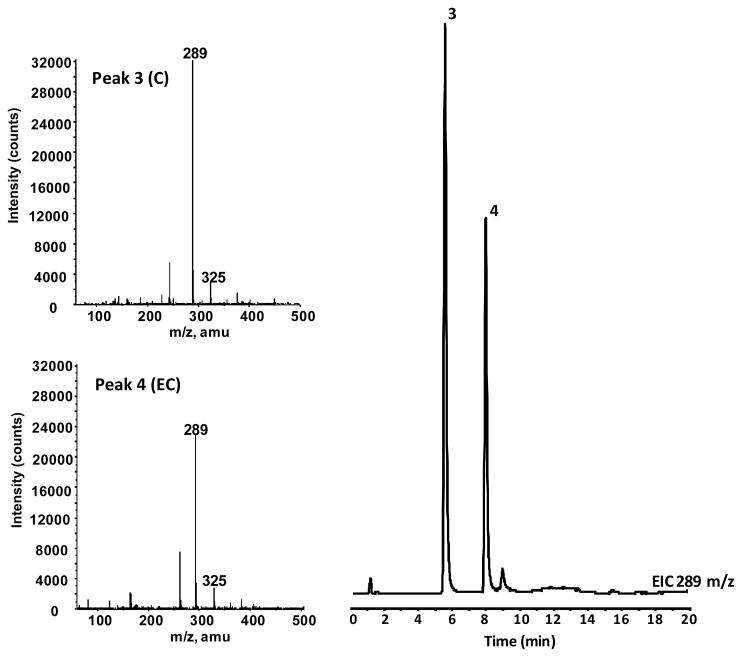
References
-
- Alzheimer’s disease facts and figures 2007 . Statistical abstract of US data on Alzheimer’s disease published by the Alzheimer’s Association. 2008. http://www.alz.org/national/documents/report_alzfactsfigures2007.pdf.
-
- Hebert LE, Scherr PA, Bienias JL, Bennett DA, Evans DA. Alzheimer Disease in the US Population: Prevalence Estimates Using the 2000 Census. Arch Neurol. 2003;60:1119–22. - PubMed
-
- Cleary J, Hittner JM, Semotuk M, Mantyh P, O’Hare E. Beta-amyloid(1–40) effects on behavior and memory. Brain Res. 1995;682:69–74. - PubMed
-
- Cleary LM. Alzheimer’s disease and family caregivers. N C Med J. 2005;66:257. - PubMed
-
- Cole GM, Frautschy SA. Alzheimer’s amyloid story finds its star. Trends Mol Med. 2006;12:395–6. - PubMed
Publication types
MeSH terms
Substances
Grants and funding
LinkOut - more resources
Full Text Sources
Medical
