

HIV Risk Behavior among Outpatients at a State Psychiatric Hospital: Prevalence and Risk Modeling
- PMID: 19626130
- PMCID: PMC2713728
- DOI: 10.1016/S0005-7894(99)80017-3
HIV Risk Behavior among Outpatients at a State Psychiatric Hospital: Prevalence and Risk Modeling
Abstract
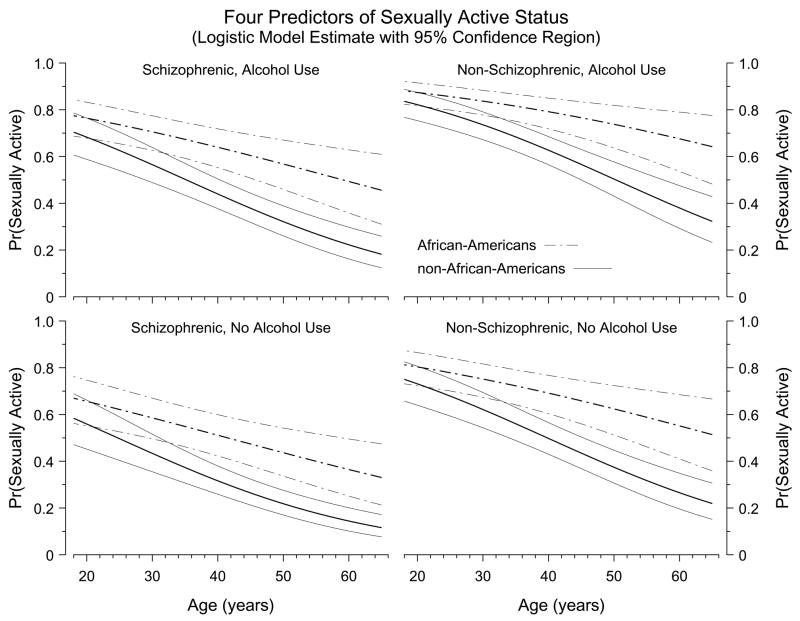
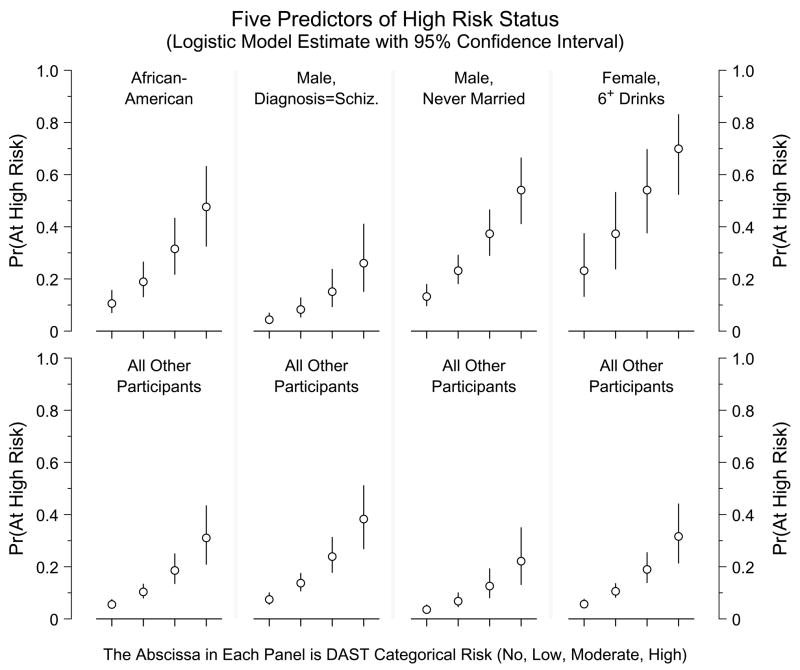
The purpose of this archival study was to determine the prevalence and correlates of HIV-related risk behavior among adults with a severe and persistent mental illness (SPMI). Hospital records at a public psychiatric hospital were reviewed to obtain data on demographic and psychiatric characteristics, sexual behavior, and substance use. Data were available from 889 (73%) of 1214 eligible outpatients. Of these 889 patients, 49% were sexually active, 52% used alcohol, and 18% used street drugs during the past year. Eleven percent were at high risk for HIV infection: 7% reported having 3 or more sexual partners, 3% had been infected with an STD, 3% had traded sex, and fewer than 1% had shared injection equipment. HIV-risk status was modeled with logistic regression using diagnosis, type of residence, drug and alcohol use, and demographic variables; five- and six-predictor models were derived for two HIV-risk indicators. A bootstrap simulation supported the reliability of each model. We conclude that approximately one-half of adults living with a SPMI are sexually active, and a minority engages in behaviors that increase risk of HIV infection. Routine screening for HIV risk in psychiatric settings can identify patients who may benefit from risk reduction programs.
Figures
References
-
- American Psychiatric Association. Diagnostic and statistical manual of mental disorders. 4. Washington DC: Author; 1994.
-
- Andreasen NC, Flaum M, Swayze VW, Tyrell G, Arndt S. Positive and negative symptoms in schizophrenia: A critical reappraisal. Archives of General Psychiatry. 1990;47:615–621. - PubMed
-
- Auerbach JD, Wypijewska C, Brodie HKH. AIDS and behavior: An integrated approach. Washington, DC: National Academy Press; 1994.
-
- Barry KL, Fleming MF. The Alcohol Use Disorders Screening Test (AUDIT) and the SMAST-13 predictive validity in a rural primary care sample. Alcohol and Alcoholism. 1993;28:33–42. - PubMed
-
- Bohn MJ, Babor TF, Kranzler HR. The Alcohol Use Disorders Screening Test (AUDIT): Validation of a screening instrument for use in medical settings. Journal of Studies on Alcohol. 1995;56:423–432. - PubMed
Grants and funding
LinkOut - more resources
Full Text Sources
Research Materials
Miscellaneous
