. 2003 Sep 3;107(38):7454-7464.
doi: 10.1021/jp035514+.

Direct Determination of Kinetic Rates from Single-Molecule Photon Arrival Trajectories Using Hidden Markov Models

Affiliations

Direct Determination of Kinetic Rates from Single-Molecule Photon Arrival Trajectories Using Hidden Markov Models

Michael Andrec et al. J Phys Chem A. .

Abstract

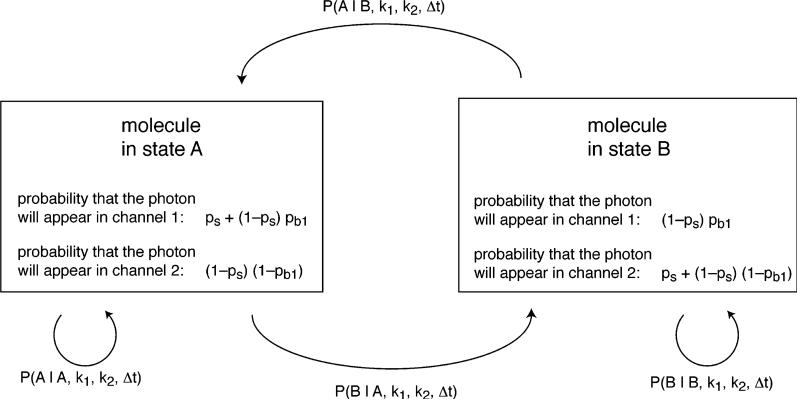
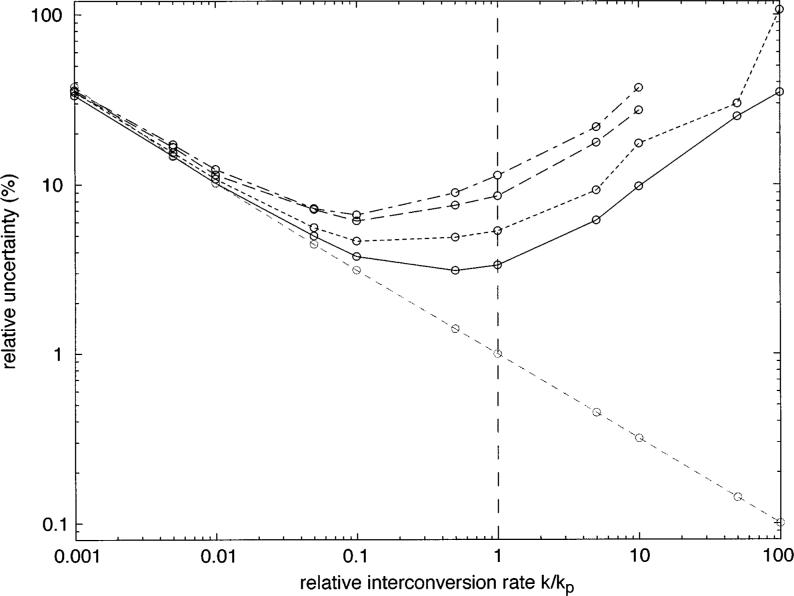
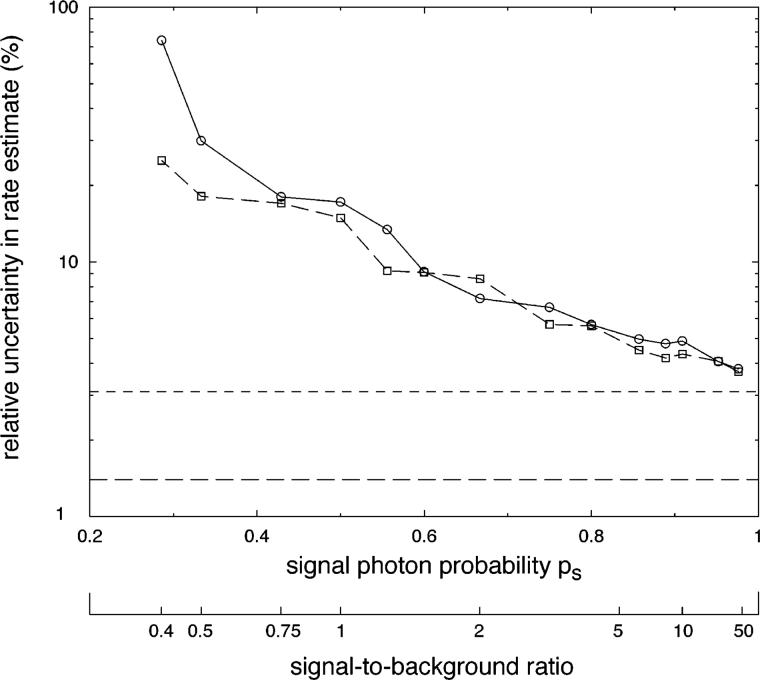
The measurement of fluorescence from single protein molecules has become an important new tool in the study of dynamic processes, allowing for the direct visualization of the motions experienced by individual proteins and macromolecular complexes. The data from such single-molecule experiments are in the form of photon trajectories, consisting of arrival times and wavelength information on individual photons. The analysis of photon trajectories can be difficult, particularly if the motions are occurring at rates comparable to the photon arrival rate or in the presence of noise. In this paper, we introduce the use of hidden Markov models (HMMs) for the analysis of photon trajectory data that operate using the photon data directly, without the need for ensemble averaging of the data as implied by correlation function analysis. Using a simple kinetic model, we examine the relationship between the uncertainty in the estimates of the motional rate and the photon detection rate. Remarkably, we obtain relative uncertainties in the rate constants of as little as 3% even when the interconversion rate is equal to the photon detection rate, and the uncertainty increases to only 10% when the interconversion rate is 10 times the photon detection rate. This suggests that useful information can be obtained for much faster kinetic regimes than have typically been studied. We also examine the impact of background photons on the determination of the rate and demonstrate that the HMM-based approach is robust, displaying small uncertainties for background photon arrival rates approaching that of the signal. These results not only are relevant in establishing the theoretical limits on precision, but are also useful in the context of experimental design. Finally, to demonstrate how the methodology can be extended to more complex kinetic models and how it can allow one to make use of the full power of statistics for purposes of model evaluation and selection, we consider a four-state kinetic model for protein conformational transitions previously studied by Schenter et al. (J. Phys. Chem. A1999, 103, 10477). We show how an HMM can be used as an alternative to higher-order correlation function analysis for the detection of "conformational memory" and apparent non-Markovian dynamics arising from such temporally inhomogeneous kinetic schemes.


Figures

Figure 1
Figure 1
Schematic diagram of the hidden Markov model used to analyze single-molecule photon trajectory data using a two-state exchange model (eq 1) that allows for the presence of background photon noise. Each box represents the state of the molecule at the time of a photon detection event. The model can “transition” from box to box (possibly returning to the box it came from) depending on the transition probabilities P(Si|Sj,k1,k2t) as given by eq 5, where Δt is the time elapsed since the previous photon detection event. Each transition corresponds to the detection of a photon. The photon can arrive in either channel 1 or channel 2, with relative probabilities given in each box (known as the “emission probabilities”). A formally identical HMM can be used to model spectral crosstalk and the combination of background scatter and crosstalk; however, the meanings of the emission probabilities would then be given by eqs 12 and 13, respectively.
Figure 2
Figure 2
Dependence of the relative uncertainty in the estimation of k as a function of the ratio k/kp, where kp is the photon detection rate (data from Table 1). The dashed gray data are for the complete information limit derived from analysis of the state trajectory data (a value of kp = 100 ms−1 was used for plotting purposes only) and are completely determined by the relative size of k and the inverse of the total observation time. The solid line corresponds to noiseless photon trajectories generated by sampling the state trajectories with a Poisson rate of kp = 100 ms−1. The remaining lines correspond to the addition of varying amounts of noise to the noiseless photon trajectories: background scatter with ps = 0.909, pb1 = 0.5 (dotted), crosstalk with pxA2 = pxB1 = 0.15 (dashed), and both (dot–dashed).
Figure 3
Figure 3
Maximum-likelihood estimate of the rate (i.e., the mode of the posterior under a uniform prior) obtained using a naive application of eq 7 to photon trajectory data containing background scatter with parameters ps = 0.909 and pb1 = 0.5 (circles) and maximum-likelihood estimates obtained using a hidden Markov model that incorporates noise (squares) as a function of the true rate k. The line of unit slope (corresponding to perfectly unbiased estimation) is shown in dashes.
Figure 4
Figure 4
Scatter plot of Metropolis Monte Carlo output for the analysis of photon trajectories containing both background and crosstalk noise (P(p1|A) = 0.818 15) generated using k = (A) 1 and (B) 1000 ms−1 using an HMM analysis. Each panel corresponds to a projection of the full set of Monte Carlo samples from the posterior probability distribution onto a plane corresponding to the interconversion rate k and the emission probability for state A. The fact that the cloud of points is elongated and tilted from the horizontal in panel B is a graphical indication that there is a weak correlation between the inferred rate and emission probability, whereas the lack of such behavior in panel A indicates the lack of correlation.
Figure 5
Figure 5
Dependence of the relative uncertainty in the estimation of k as a function of the background photon level for a 100-ms photon trajectory generated using k = 50 ms−1, kp = 100 ms−1, pb1 = 0.5 (solid/circles), and pb1 = 0.8 (dashed/squares). The signal-to-background ratio is defined to be ps/(1 − ps). The lower long-dashed horizontal line represents the theoretical lower bound on the relative uncertainty corresponding to the complete information limit, whereas the upper horizontal short-dashed line represents the ps = 0 limit corresponding to sampling the state trajectory with a Poisson rate of kp = 100 ms−1
None

References

    1. Moerner WE. J. Phys. Chem. B. 2002;106:910–927.
    1. Rigler R, Edman L, Foldes-Papp Z, Wennmalm S. Springer Ser. Chem. Phys. 2001;67:177–194.
    1. Xie XS, Lu HP. Springer Ser. Chem. Phys. 2001;67:227–240.
    1. Basche T, Nie S, Fernandez JM. Proc. Natl. Acad. Sci. U.S.A. 2001;98:10527–10528. - PMC - PubMed
    1. Weiss S. Nat. Struct. Biol. 2000;7:724–729. - PubMed

LinkOut - more resources