

Rapid quantification of disease-marker proteins using continuous-flow immunoseparation in a nanosieve fluidic device
- PMID: 19627123
- PMCID: PMC2846189
- DOI: 10.1021/ac901226z
Rapid quantification of disease-marker proteins using continuous-flow immunoseparation in a nanosieve fluidic device
Abstract
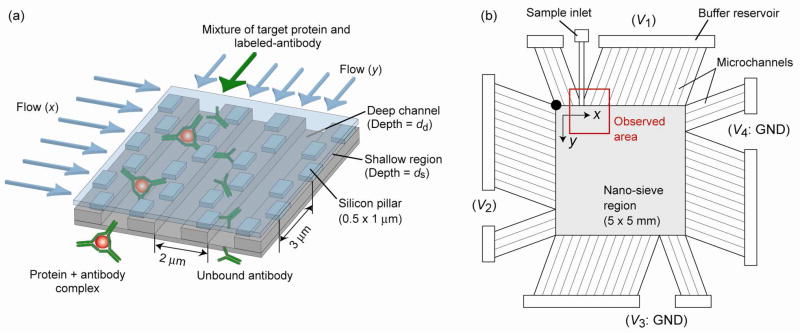
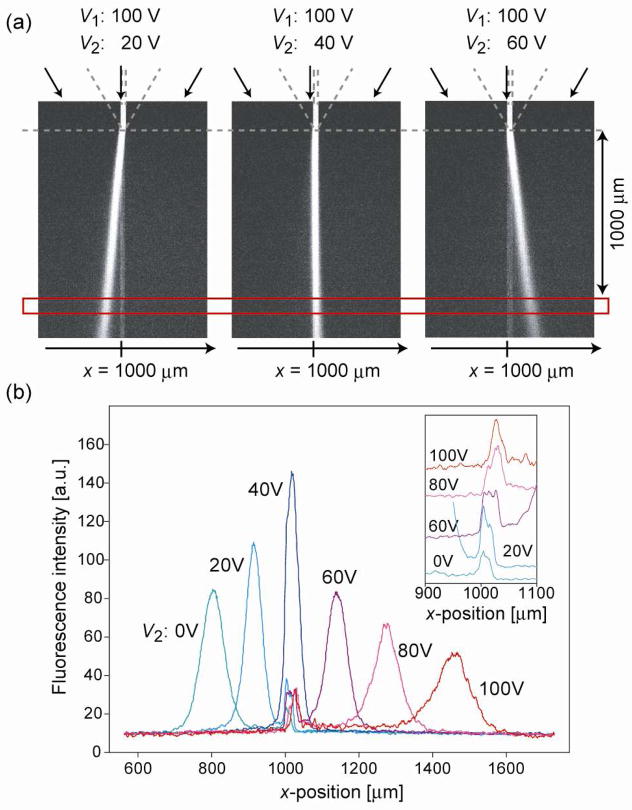
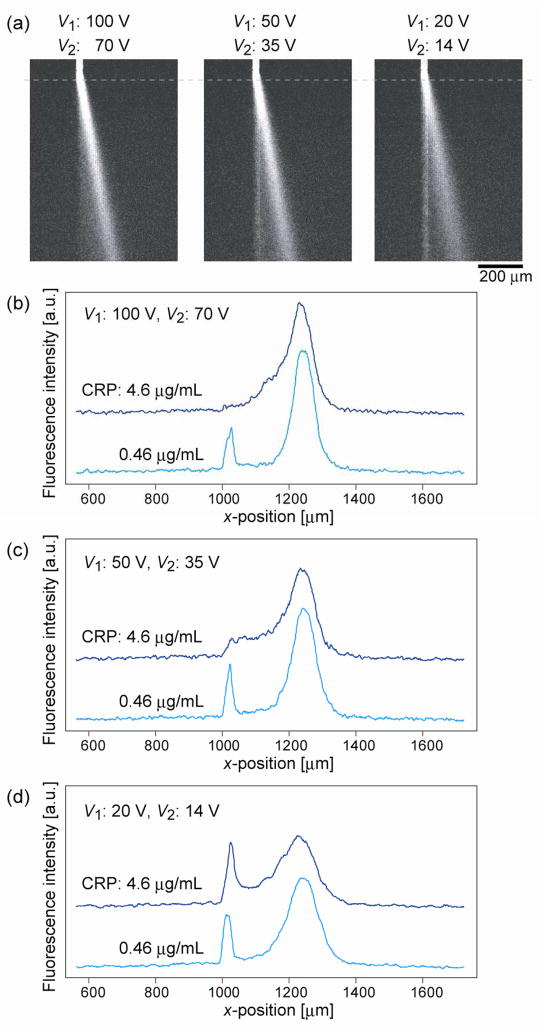
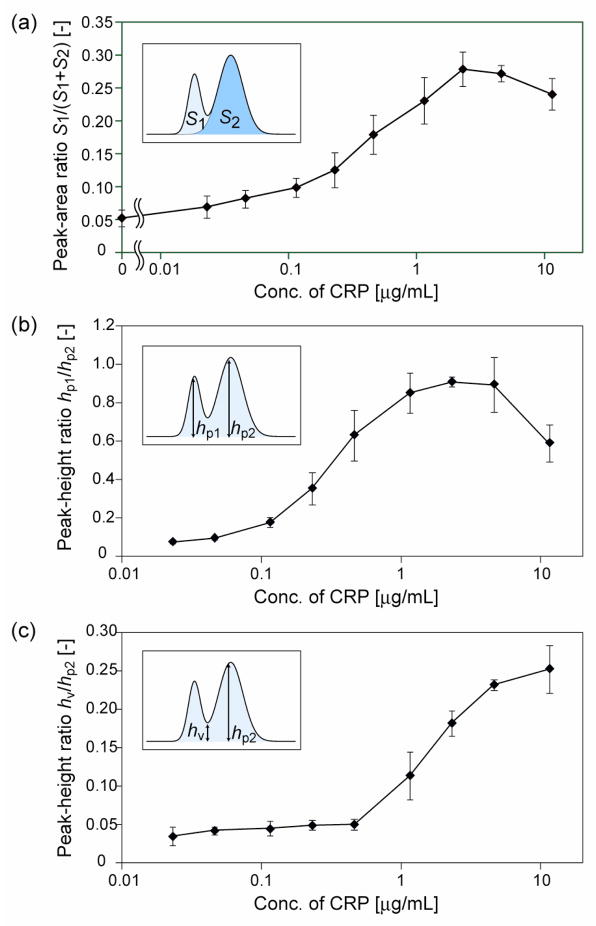
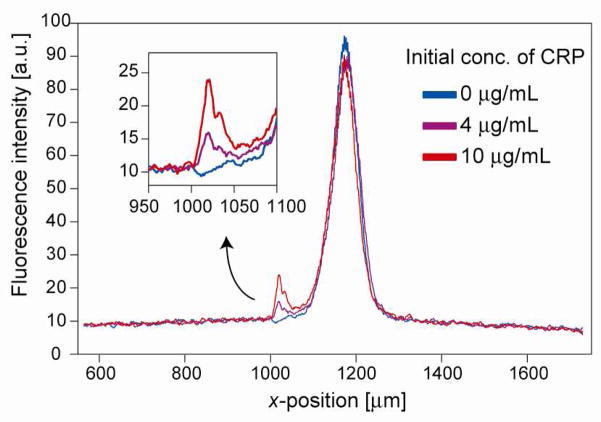
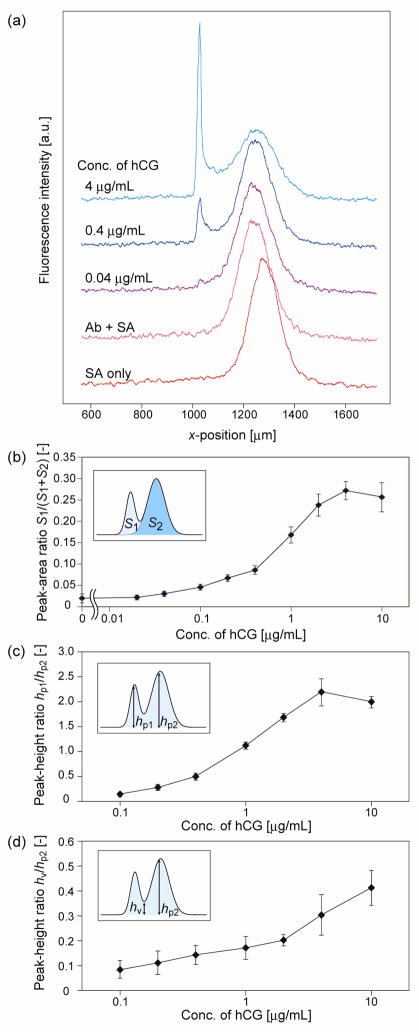
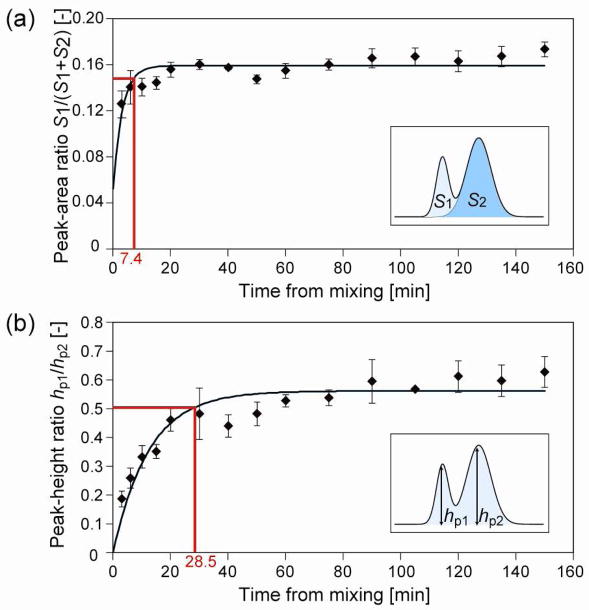
Nanometer-scale fluidic devices offer an alternative to gels for separating biomolecules with better control and accuracy. Here we demonstrate the quantitative analysis of disease-marker proteins by continuously separating the antibody-protein immunocomplexes from the unbound antibodies, utilizing the anisotropically patterned nanosieve array (ANA) structures. The ANA structures, composed of periodically patterned deep channels and shallow regions, allow the small antibodies to pass through the shallow regions easier than the large immunocomplex, when the flow-field is applied in an oblique direction. We examined two proteins used as disease markers, human C-reactive protein (CRP) and human chorionic gonadotropin (hCG), by using fluorescent-labeled polyclonal antibodies. We showed that the size of the immunocomplex and the field strength are the critical factors for the separation, and we successfully demonstrated the quantification of the proteins in the range of 0.05 to 10 microg/mL. Additionally, this device allows a convenient measurement of homogeneous binding kinetics, without the need for repeated binding experiments and immobilizing the molecules. The presented nanofluidic device will be a useful tool for the rapid quantification and the preparative immunoseparation of the target proteins.
Figures
Similar articles
-
Continuous-flow bioseparation using microfabricated anisotropic nanofluidic sieving structures.Nat Protoc. 2009;4(11):1681-98. doi: 10.1038/nprot.2009.176. Epub 2009 Oct 29. Nat Protoc. 2009. PMID: 19876028 Free PMC article.
-
Continuous-flow biomolecule concentration and detection in a slanted nanofilter array.Lab Chip. 2012 Nov 7;12(21):4441-8. doi: 10.1039/c2lc40195a. Lab Chip. 2012. PMID: 22955573
-
Electrical detection of protein biomarkers using bioactivated microfluidic channels.Lab Chip. 2009 May 21;9(10):1429-34. doi: 10.1039/b818872f. Epub 2009 Mar 2. Lab Chip. 2009. PMID: 19417910 Free PMC article.
-
The Role of Human Chorionic Gonadotropin as Tumor Marker: Biochemical and Clinical Aspects.Adv Exp Med Biol. 2015;867:159-76. doi: 10.1007/978-94-017-7215-0_11. Adv Exp Med Biol. 2015. PMID: 26530366 Review.
-
Integrated fluidic systems on a nanometer scale and the study on behavior of liquids in small confinement.J Chromatogr A. 2009 Jan 23;1216(4):673-83. doi: 10.1016/j.chroma.2008.12.010. Epub 2008 Dec 9. J Chromatogr A. 2009. PMID: 19121833 Review.
Cited by
-
Effect of channel geometry on ion-concentration polarization-based preconcentration and desalination.Biomicrofluidics. 2019 Nov 1;13(6):064102. doi: 10.1063/1.5124787. eCollection 2019 Nov. Biomicrofluidics. 2019. PMID: 31700561 Free PMC article.
-
Nanofluidic device for continuous multiparameter quality assurance of biologics.Nat Nanotechnol. 2017 Aug;12(8):804-812. doi: 10.1038/nnano.2017.74. Epub 2017 May 22. Nat Nanotechnol. 2017. PMID: 28530715
-
Membrane-assisted online renaturation for automated microfluidic lectin blotting.J Am Chem Soc. 2011 Dec 14;133(49):19610-3. doi: 10.1021/ja207963f. Epub 2011 Nov 18. J Am Chem Soc. 2011. PMID: 22070432 Free PMC article.
-
Creating sub-50 nm nanofluidic junctions in a PDMS microchip via self-assembly process of colloidal silica beads for electrokinetic concentration of biomolecules.Lab Chip. 2014 Dec 7;14(23):4455-60. doi: 10.1039/c4lc00895b. Epub 2014 Sep 25. Lab Chip. 2014. PMID: 25254651 Free PMC article.
-
Creating Sub-50 Nm Nanofluidic Junctions in PDMS Microfluidic Chip via Self-Assembly Process of Colloidal Particles.J Vis Exp. 2016 Mar 13;(109):54145. doi: 10.3791/54145. J Vis Exp. 2016. PMID: 27023724 Free PMC article.
References
-
- Sato K, Tokeshi M, Odake T, Kimura H, Ooi T, Nakao M, Kitamori T. Anal Chem. 2000;72:1144–1147. - PubMed
-
- Bernard A, Michel B, Delamarche E. Anal Chem. 2001;73:8–12. - PubMed
-
- Yakovleva J, Davidsson R, Lobanova A, Bengtsson M, Eremin S, Laurell T, Emneus J. Anal Chem. 2002;74:2994–3004. - PubMed
-
- Hosokawa K, Omata M, Maeda M. Anal Chem. 2007;79:6000–6004. - PubMed
Publication types
MeSH terms
Substances
Grants and funding
LinkOut - more resources
Full Text Sources
Other Literature Sources
Research Materials
Miscellaneous
