Genomic imbalances in precancerous tissues signal oral cancer risk
- PMID: 19627613
- PMCID: PMC2726119
- DOI: 10.1186/1476-4598-8-50
Genomic imbalances in precancerous tissues signal oral cancer risk
Abstract
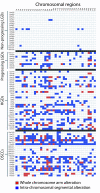
Oral cancer develops through a series of histopathological stages: through mild (low grade), moderate, and severe (high grade) dysplasia to carcinoma in situ and then invasive disease. Early detection of those oral premalignant lesions (OPLs) that will develop into invasive tumors is necessary to improve the poor prognosis of oral cancer. Because no tools exist for delineating progression risk in low grade oral lesions, we cannot determine which of these cases require aggressive intervention. We undertook whole genome analysis by tiling-path array comparative genomic hybridization for a rare panel of early and late stage OPLs (n = 62), all of which had extensive longitudinal follow up (>10 years). Genome profiles for oral squamous cell carcinomas (n = 24) were generated for comparison. Parallel analysis of genome alterations and clinical parameters was performed to identify features associated with disease progression. Genome alterations in low grade dysplasias progressing to invasive disease more closely resembled those observed for later stage disease than they did those observed for non-progressing low grade dysplasias. This was despite the histopathological similarity between progressing and non-progressing cases. Strikingly, unbiased computational analysis of genomic alteration data correctly classified nearly all progressing low grade dysplasia cases. Our data demonstrate that high resolution genomic analysis can be used to evaluate progression risk in low grade OPLs, a marked improvement over present histopathological approaches which cannot delineate progression risk. Taken together, our data suggest that whole genome technologies could be used in management strategies for patients presenting with precancerous oral lesions.
Figures


Similar articles
-
Multiple aberrations of chromosome 3p detected in oral premalignant lesions.Cancer Prev Res (Phila). 2008 Nov;1(6):424-9. doi: 10.1158/1940-6207.CAPR-08-0123. Cancer Prev Res (Phila). 2008. PMID: 19138989 Free PMC article.
-
Progress risk assessment of oral premalignant lesions with saliva miRNA analysis.BMC Cancer. 2013 Mar 19;13:129. doi: 10.1186/1471-2407-13-129. BMC Cancer. 2013. PMID: 23510112 Free PMC article.
-
Multiple pathways in the FGF signaling network are frequently deregulated by gene amplification in oral dysplasias.Int J Cancer. 2009 Nov 1;125(9):2219-28. doi: 10.1002/ijc.24611. Int J Cancer. 2009. PMID: 19623652 Free PMC article.
-
Genetic Changes Driving Immunosuppressive Microenvironments in Oral Premalignancy.Front Immunol. 2022 Jan 27;13:840923. doi: 10.3389/fimmu.2022.840923. eCollection 2022. Front Immunol. 2022. PMID: 35154165 Free PMC article. Review.
-
Genomic DNA copy number alterations from precursor oral lesions to oral squamous cell carcinoma.Oral Oncol. 2014 May;50(5):404-12. doi: 10.1016/j.oraloncology.2014.02.005. Epub 2014 Mar 7. Oral Oncol. 2014. PMID: 24613650 Review.
Cited by
-
Transcriptome profiles of carcinoma-in-situ and invasive non-small cell lung cancer as revealed by SAGE.PLoS One. 2010 Feb 11;5(2):e9162. doi: 10.1371/journal.pone.0009162. PLoS One. 2010. PMID: 20161782 Free PMC article.
-
The identification of significant chromosomal regions correlated with oral tongue cancer progression.J Cancer Res Clin Oncol. 2012 Oct;138(10):1667-77. doi: 10.1007/s00432-012-1241-z. Epub 2012 May 26. J Cancer Res Clin Oncol. 2012. PMID: 22638883 Free PMC article.
-
Molecular Biomarkers of Malignant Transformation in Head and Neck Dysplasia.Cancers (Basel). 2022 Nov 15;14(22):5581. doi: 10.3390/cancers14225581. Cancers (Basel). 2022. PMID: 36428690 Free PMC article. Review.
-
Detection of clinically relevant copy number alterations in oral cancer progression using multiplexed droplet digital PCR.Sci Rep. 2017 Sep 19;7(1):11855. doi: 10.1038/s41598-017-11201-4. Sci Rep. 2017. PMID: 28928368 Free PMC article.
-
Two distinct routes to oral cancer differing in genome instability and risk for cervical node metastasis.Clin Cancer Res. 2011 Nov 15;17(22):7024-34. doi: 10.1158/1078-0432.CCR-11-1944. Epub 2011 Nov 8. Clin Cancer Res. 2011. PMID: 22068658 Free PMC article.
References
-
- Wright JM. A review and update of oral precancerous lesions. Tex Dent J. 1998;115:15–19. - PubMed
-
- Rosin MP, Cheng X, Poh C, Lam WL, Huang Y, Lovas J, Berean K, Epstein JB, Priddy R, Le ND, Zhang L. Use of allelic loss to predict malignant risk for low-grade oral epithelial dysplasia. Clin Cancer Res. 2000;6:357–362. - PubMed
Publication types
MeSH terms
Grants and funding
LinkOut - more resources
Full Text Sources
Medical
Molecular Biology Databases

