

Combining Google Earth and GIS mapping technologies in a dengue surveillance system for developing countries
- PMID: 19627614
- PMCID: PMC2729741
- DOI: 10.1186/1476-072X-8-49
Combining Google Earth and GIS mapping technologies in a dengue surveillance system for developing countries
Abstract
Background: Dengue fever is a mosquito-borne illness that places significant burden on tropical developing countries with unplanned urbanization. A surveillance system using Google Earth and GIS mapping technologies was developed in Nicaragua as a management tool.
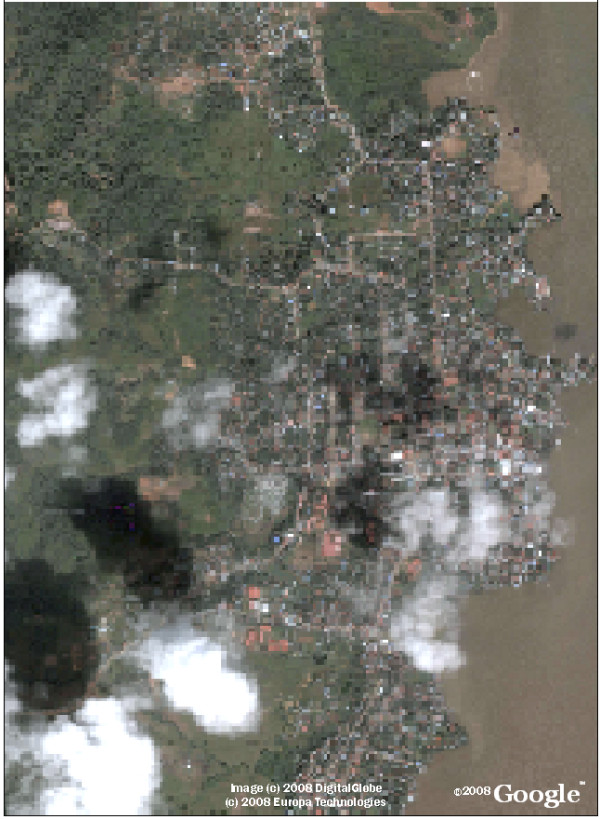
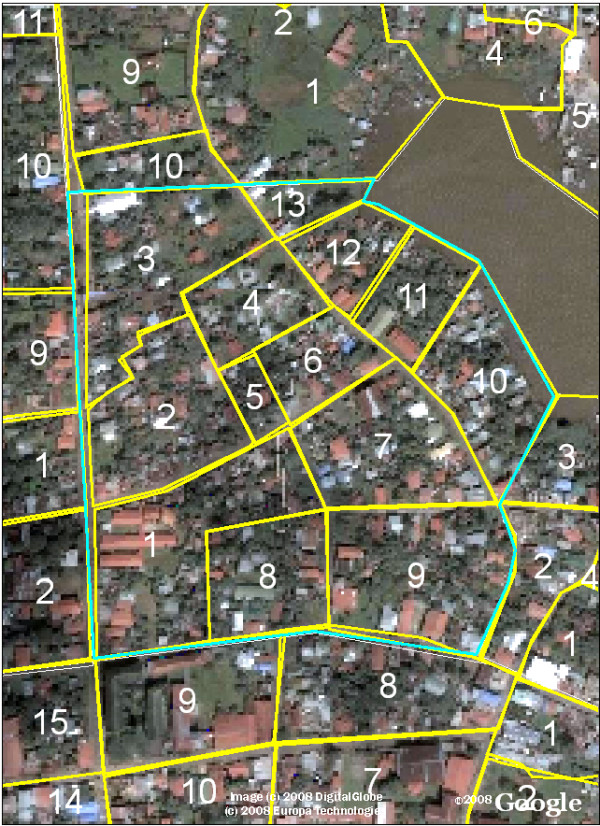
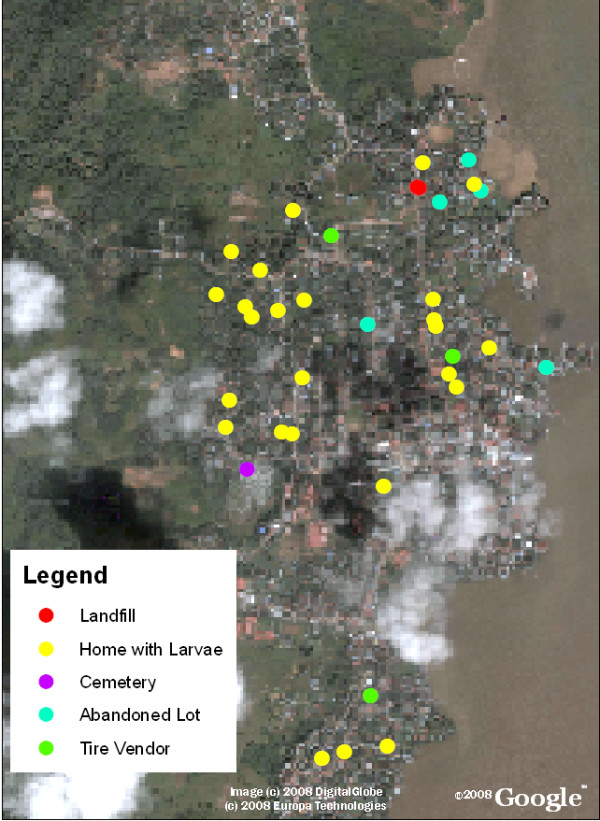
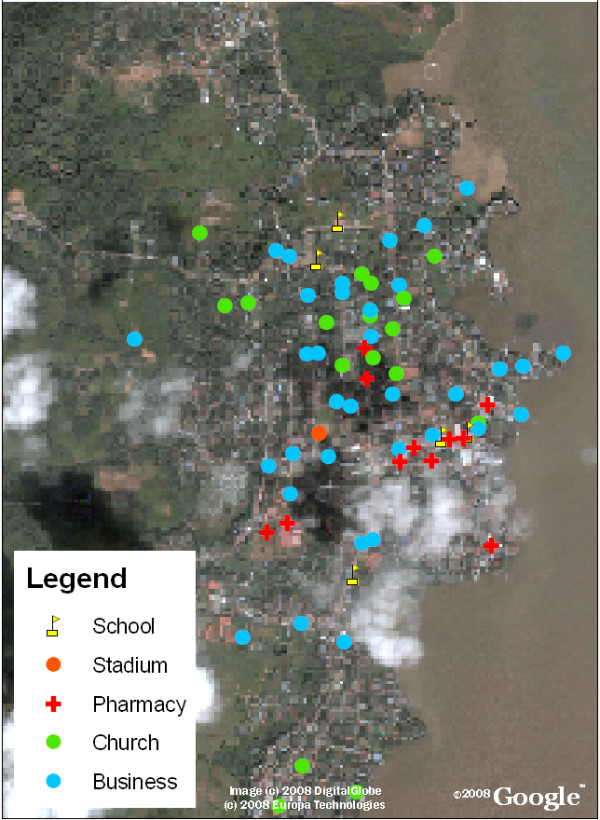
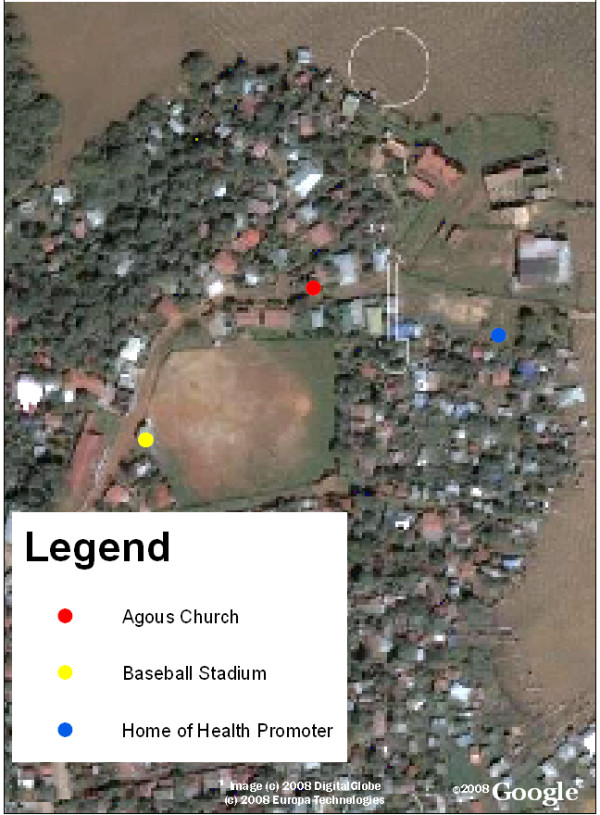
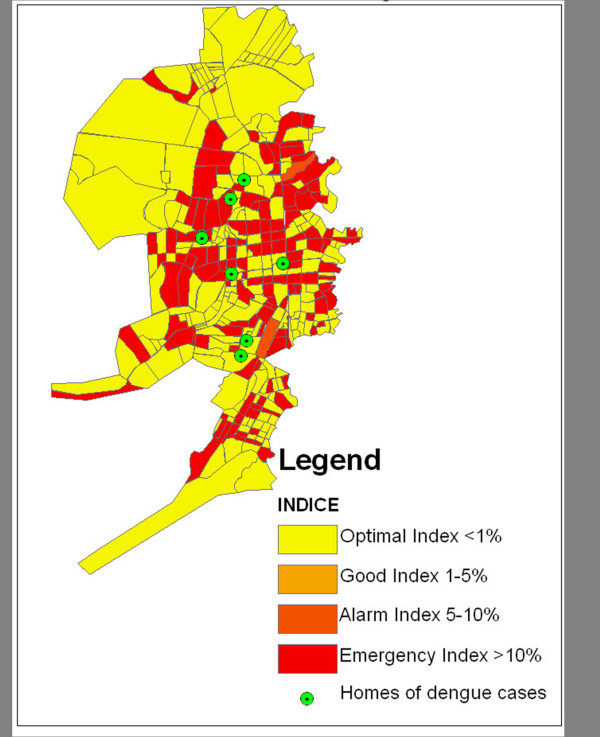
Methods and results: Satellite imagery of the town of Bluefields, Nicaragua captured from Google Earth was used to create a base-map in ArcGIS 9. Indices of larval infestation, locations of tire dumps, cemeteries, large areas of standing water, etc. that may act as larval development sites, and locations of the homes of dengue cases collected during routine epidemiologic surveying were overlaid onto this map. Visual imagery of the location of dengue cases, larval infestation, and locations of potential larval development sites were used by dengue control specialists to prioritize specific neighborhoods for targeted control interventions.
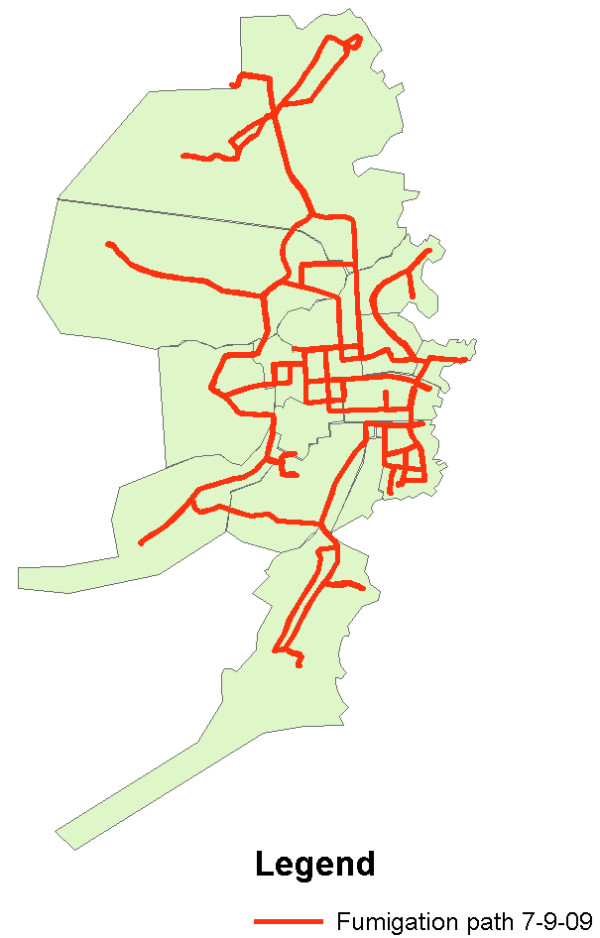
Conclusion: This dengue surveillance program allows public health workers in resource-limited settings to accurately identify areas with high indices of mosquito infestation and interpret the spatial relationship of these areas with potential larval development sites such as garbage piles and large pools of standing water. As a result, it is possible to prioritize control strategies and to target interventions to highest risk areas in order to eliminate the likely origin of the mosquito vector. This program is well-suited for resource-limited settings since it utilizes readily available technologies that do not rely on Internet access for daily use and can easily be implemented in many developing countries for very little cost.
Figures
References
-
- Gubler DJ. Dengue/dengue haemorrhagic fever: history and current status. Novartis Found Symp. 2006;277:3–16. - PubMed
-
- Harrington LC, Scott TW, Lerdthusnee K, Coleman RC, Costero A, Clark GG, Jones JJ, Kitthawee S, Kittayapong P, Sithiprasasna R, et al. Dispersal of the dengue vector Aedes aegypti within and between rural communities. Am J Trop Med Hyg. 2005;72:209–220. - PubMed
-
- Castle T, Amador M, Rawlins S, Figueroa JP, Reiter P. Absence of impact of aerial malathion treatment on Aedes aegypti during a dengue outbreak in Kingston, Jamaica. Rev Panam Salud Publica. 1999;5:100–105. - PubMed
-
- Gubler D. The emergence of epidemic dengue fever and dengue hemorrhagic fever in the Americas: a case of failed public health policy. Rev Panam Salud Publica. 2005;17:221–224. - PubMed
-
- Gubler DJ. Aedes aegypti and Aedes aegypti-borne disease control in the 1990s: top down or bottom up. Charles Franklin Craig Lecture. Am J Trop Med Hyg. 1989;40:571–578. - PubMed
Publication types
MeSH terms
LinkOut - more resources
Full Text Sources
Medical
Research Materials
