

Roles of interaction between actuator and nucleotide binding domains of sarco(endo)plasmic reticulum Ca(2+)-ATPase as revealed by single and swap mutational analyses of serine 186 and glutamate 439
- PMID: 19628462
- PMCID: PMC2757222
- DOI: 10.1074/jbc.M109.034140
Roles of interaction between actuator and nucleotide binding domains of sarco(endo)plasmic reticulum Ca(2+)-ATPase as revealed by single and swap mutational analyses of serine 186 and glutamate 439
Abstract
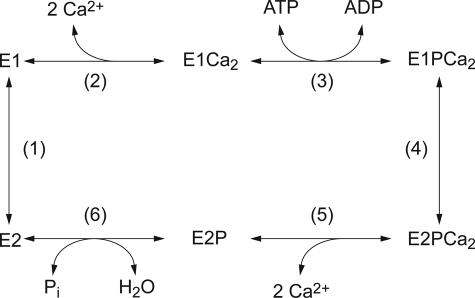
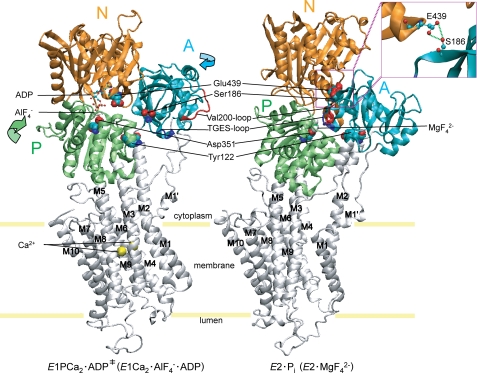
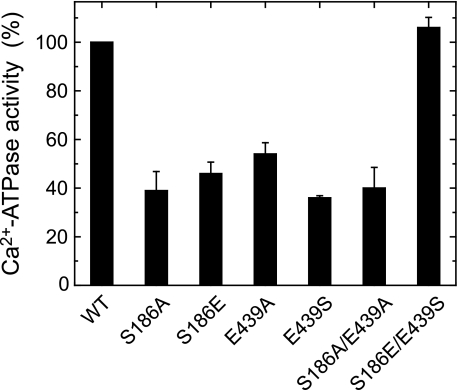
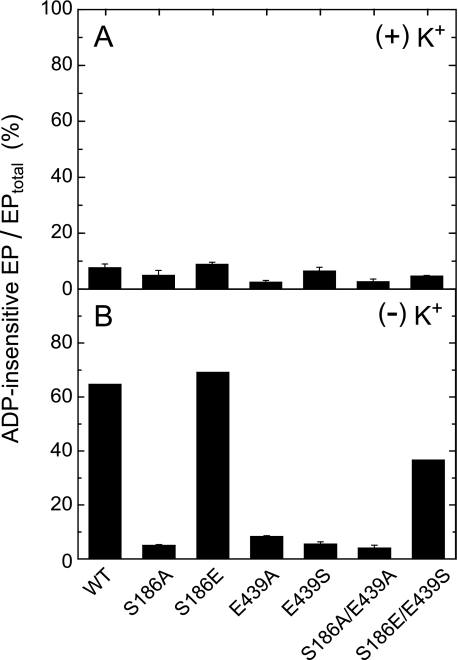
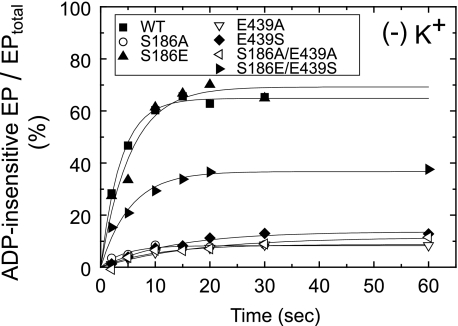
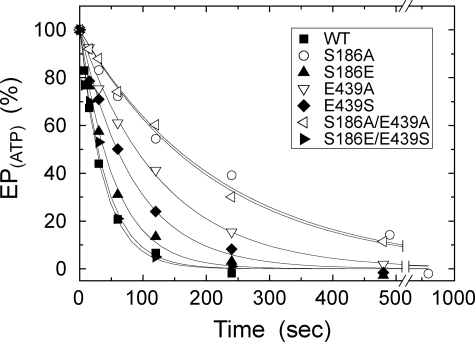
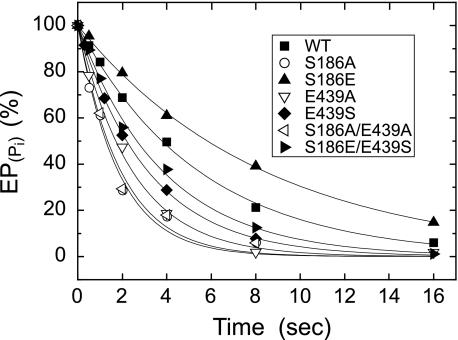
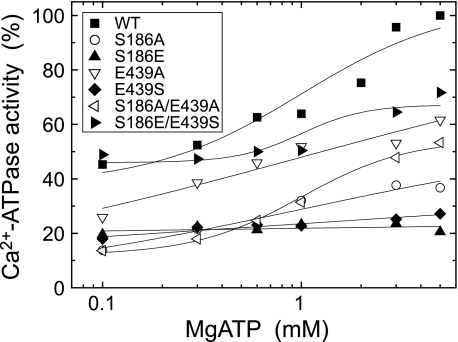
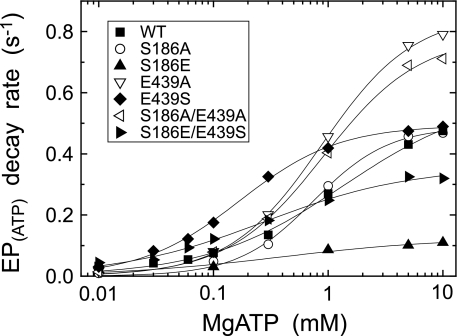
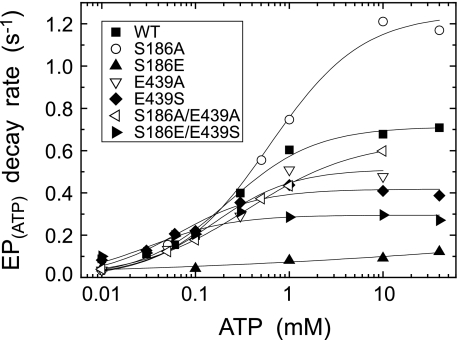
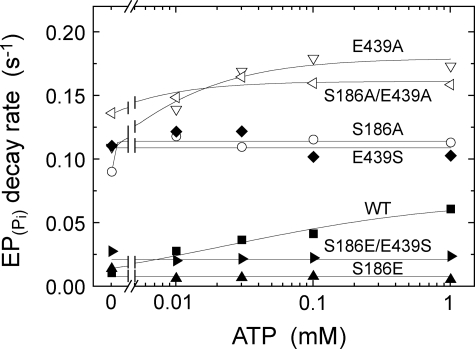
Roles of hydrogen bonding interaction between Ser(186) of the actuator (A) domain and Glu(439) of nucleotide binding (N) domain seen in the structures of ADP-insensitive phosphorylated intermediate (E2P) of sarco(endo)plasmic reticulum Ca(2+)-ATPase were explored by their double alanine substitution S186A/E439A, swap substitution S186E/E439S, and each of these single substitutions. All the mutants except the swap mutant S186E/E439S showed markedly reduced Ca(2+)-ATPase activity, and S186E/E439S restored completely the wild-type activity. In all the mutants except S186E/E439S, the isomerization of ADP-sensitive phosphorylated intermediate (E1P) to E2P was markedly retarded, and the E2P hydrolysis was largely accelerated, whereas S186E/E439S restored almost the wild-type rates. Results showed that the Ser(186)-Glu(439) hydrogen bond stabilizes the E2P ground state structure. The modulatory ATP binding at sub-mm approximately mm range largely accelerated the EP isomerization in all the alanine mutants and E439S. In S186E, this acceleration as well as the acceleration of the ATPase activity was almost completely abolished, whereas the swap mutation S186E/E439S restored the modulatory ATP acceleration with a much higher ATP affinity than the wild type. Results indicated that Ser(186) and Glu(439) are closely located to the modulatory ATP binding site for the EP isomerization, and that their hydrogen bond fixes their side chain configurations thereby adjusts properly the modulatory ATP affinity to respond to the cellular ATP level.
Figures
Similar articles
-
Modulatory ATP binding affinity in intermediate states of E2P dephosphorylation of sarcoplasmic reticulum Ca2+-ATPase.J Biol Chem. 2011 Apr 1;286(13):11792-802. doi: 10.1074/jbc.M110.206094. Epub 2011 Feb 2. J Biol Chem. 2011. PMID: 21288896 Free PMC article.
-
Val200 residue in Lys189-Lys205 outermost loop on the A domain of sarcoplasmic reticulum Ca2+-ATPase is critical for rapid processing of phosphoenzyme intermediate after loss of ADP sensitivity.J Biol Chem. 2003 Mar 14;278(11):9624-9. doi: 10.1074/jbc.M208861200. Epub 2002 Dec 19. J Biol Chem. 2003. PMID: 12496291
-
Deletions of any single residues in Glu40-Ser48 loop connecting a domain and the first transmembrane helix of sarcoplasmic reticulum Ca(2+)-ATPase result in almost complete inhibition of conformational transition and hydrolysis of phosphoenzyme intermediate.J Biol Chem. 2003 Oct 3;278(40):39197-204. doi: 10.1074/jbc.M305200200. Epub 2003 Jul 11. J Biol Chem. 2003. PMID: 12857730
-
Structural basis of the conformational and functional regulation of human SERCA2b, the ubiquitous endoplasmic reticulum calcium pump.Bioessays. 2022 Jul;44(7):e2200052. doi: 10.1002/bies.202200052. Epub 2022 May 13. Bioessays. 2022. PMID: 35560336 Review.
-
Phospholamban and sarcolipin: Are they functionally redundant or distinct regulators of the Sarco(Endo)Plasmic Reticulum Calcium ATPase?J Mol Cell Cardiol. 2016 Feb;91:81-91. doi: 10.1016/j.yjmcc.2015.12.030. Epub 2015 Dec 29. J Mol Cell Cardiol. 2016. PMID: 26743715 Free PMC article. Review.
Cited by
-
Critical roles of interdomain interactions for modulatory ATP binding to sarcoplasmic reticulum Ca2+-ATPase.J Biol Chem. 2014 Oct 17;289(42):29123-34. doi: 10.1074/jbc.M114.571687. Epub 2014 Sep 5. J Biol Chem. 2014. PMID: 25193668 Free PMC article.
-
Modulatory ATP binding affinity in intermediate states of E2P dephosphorylation of sarcoplasmic reticulum Ca2+-ATPase.J Biol Chem. 2011 Apr 1;286(13):11792-802. doi: 10.1074/jbc.M110.206094. Epub 2011 Feb 2. J Biol Chem. 2011. PMID: 21288896 Free PMC article.
-
Roles of long-range electrostatic domain interactions and K+ in phosphoenzyme transition of Ca2+-ATPase.J Biol Chem. 2013 Jul 12;288(28):20646-57. doi: 10.1074/jbc.M113.482711. Epub 2013 Jun 4. J Biol Chem. 2013. PMID: 23737524 Free PMC article.
-
Conformational Transitions and Alternating-Access Mechanism in the Sarcoplasmic Reticulum Calcium Pump.J Mol Biol. 2017 Mar 10;429(5):647-666. doi: 10.1016/j.jmb.2017.01.007. Epub 2017 Jan 16. J Mol Biol. 2017. PMID: 28093226 Free PMC article.
References
-
- Hasselbach W., Makinose M. (1961) Biochem. Z. 333, 518–528 - PubMed
-
- Inesi G., Sumbilla C., Kirtley M. E. (1990) Physiol. Rev. 70, 749–760 - PubMed
-
- Møller J. V., Juul B., le Maire M. (1996) Biochim. Biophys. Acta 1286, 1–51 - PubMed
-
- MacLennan D. H., Rice W. J., Green N. M. (1997) J. Biol. Chem. 272, 28815–28818 - PubMed
Publication types
MeSH terms
Substances
LinkOut - more resources
Full Text Sources
Molecular Biology Databases
Miscellaneous
