. 2009;60(13):3891-908.
doi: 10.1093/jxb/erp234. Epub 2009 Jul 23.

Transcriptional profiling of maturing tomato (Solanum lycopersicum L.) microspores reveals the involvement of heat shock proteins, ROS scavengers, hormones, and sugars in the heat stress response

Affiliations

Transcriptional profiling of maturing tomato (Solanum lycopersicum L.) microspores reveals the involvement of heat shock proteins, ROS scavengers, hormones, and sugars in the heat stress response

Gil Frank et al. J Exp Bot. 2009.

Abstract

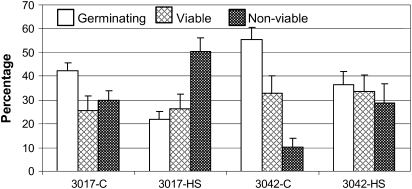
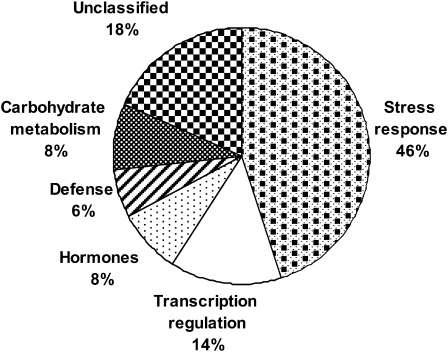
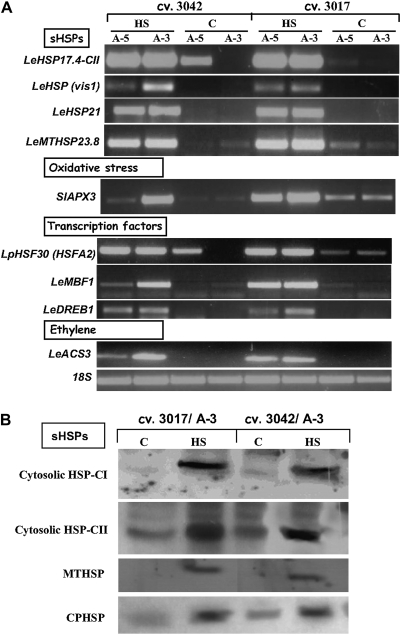
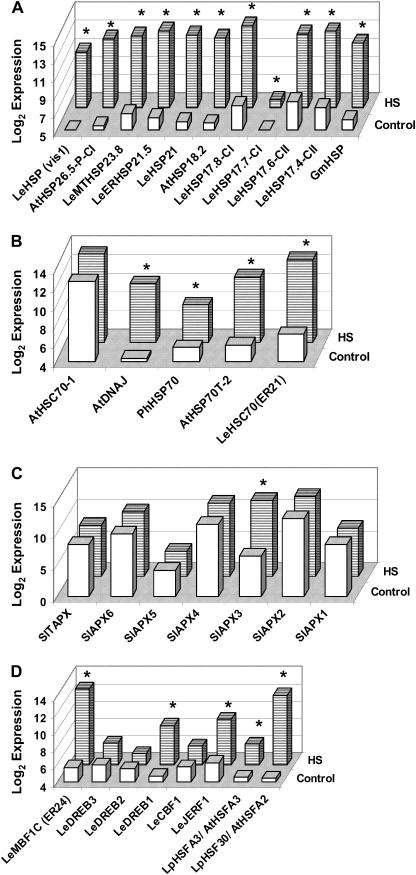
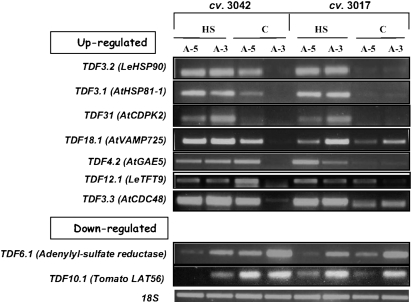
Above-optimal temperatures reduce yield in tomato largely because of the high heat stress (HS) sensitivity of the developing pollen grains. The high temperature response, especially at this most HS-sensitive stage of the plant, is poorly understood. To obtain an overview of molecular mechanisms underlying the HS response (HSR) of microspores, a detailed transcriptomic analysis of heat-stressed maturing tomato microspores was carried out using a combination of Affymetrix Tomato Genome Array and cDNA-amplified fragment length polymorphism (AFLP) techniques. The results were corroborated by reverse transcription-PCR (RT-PCR) and immunoblot analyses. The data obtained reveal the involvement of specific members of the small heat shock protein (HSP) gene family, HSP70 and HSP90, in addition to the HS transcription factors A2 (HSFA2) and HSFA3, as well as factors other than the classical HS-responsive genes. The results also indicate HS regulation of reactive oxygen species (ROS) scavengers, sugars, plant hormones, and regulatory genes that were previously implicated in other types of stress. The use of cDNA-AFLP enabled the detection of genes representing pollen-specific functions that are missing from the tomato Affymetrix chip, such as those involved in vesicle-mediated transport and a pollen-specific, calcium-dependent protein kinase (CDPK2). For several genes, including LeHSFA2, LeHSP17.4-CII, as well as homologues of LeHSP90 and AtVAMP725, higher basal expression levels were detected in microspores of cv. Hazera 3042 (a heat-tolerant cultivar) compared with microspores of cv. Hazera 3017 (a heat-sensitive cultivar), marking these genes as candidates for taking part in microspore thermotolerance. This work provides a comprehensive analysis of the molecular events underlying the HSR of maturing microspores of a crop plant, tomato.


Figures

Fig. 1.
Fig. 1.
Effect of heat stress on tomato pollen quality. Tomato plants of cv. Hazera 3017 (heat sensitive) and cv. Hazera 3042 (heat tolerant) were exposed to a short-term HS (2 h at 43–45 °C). Pollen grains were collected from the heat-stressed (HS) plants of both cultivars (3017-HS, 3042-HS) and from control (C) plants (3017-C, 3042-C) 7, 6, 5, and 3 d after stress application. Mean values ±SE of the percentage germinating pollen grains, percentage viable pollen grains, and percentage non-viable pollen grains are presented. The mean values were calculated from the combined results of all tested developmental stages, derived from at least five biological replicates. The total number of pollen grains in both cultivars under control and HS conditions was similar and ranged between 38 and 50×103.
Fig. 2.
Fig. 2.
Graphical representation of the percentage of genes belonging to a given functional group for the 49 heat-regulated genes that are presented in Table 1.
Fig. 3.
Fig. 3.
Validation of the microarray analysis results by semi-quantitative RT-PCR (A) and immunoblot (B) analyses. Expression levels were tested using either RNA (A) or protein (B), extracted from maturing microspores (5 d and/or 3 d before anthesis; A-5 and/or A-3, respectively) of at least 100 flowers, derived from plants of cv. Hazera 3017 and cv. Hazera 3042, which had been either kept under control conditions or exposed to HS (2 h at 43–45 °C). (A) Expression values were determined by semi-quantitative RT-PCR using gene-specific primers and at least three biological replicates. Several dilutions of template cDNA were tested in order to ensure that gene amplification was in the linear range, and expression levels are compared with expression of the 18S gene (accession X51576). (B) Expression was determined by immunoblot analysis, using 2 μg of total protein, extracted from maturing microspores at A-3, as detailed above. The blot was probed with polyclonal antibodies raised against class I and class II Arabidopsis 17.6 sHSPs (cytosolic HSP-CI and cytosolic HSP-CII, respectively; a gift from Professor E Vierling, University of Arizona, Tucson, AZ, USA), Chenopodium mitochondrial sHSP (MTHSP; a gift from Professor A Gau, University of Hannover, Hannover, Germany), and spinach chloroplast sHSP (CPHSP; a gift from Professor A Perl, The Volcani Center, ARO, Israel). The presented blot represents the results of three biological replicates. Gene names are abbreviated according to the nomenclature used by the NCBI, and the corresponding accession or AGI numbers as well as the Affy ID numbers appear in Table 1.
Fig. 4.
Fig. 4.
Effect of heat stress on the expression profiles of small heat shock protein (sHSP; A), HSP70 (B), and ascorbate peroxidase (APX; C) family members and of genes involved in transcription regulation (D) in maturing microspores. Expression values presented here correspond to the normalized, log base 2, mean expression values of heat-stressed (12 replicates) and control (12 replicates) microspores. Genes whose expression levels differ significantly (P <0.05) between HS and control conditions [based on the procedure described in the section ‘Array hybridization and statistical analysis’, using the LIMMA package (Smyth, 2004)] are marked by an asterisk. More details regarding the plant material and the experimental procedure are given in the legend to Fig. 3 and in Materials and methods. Only the genes represented on the Tomato Affymetrix array were analysed. Gene names are abbreviated according to the nomenclature used by the NCBI, and the corresponding accession or AGI numbers as well as Affy ID numbers appear in Table 1 and in Supplementary Table S3 at JXB online. CI, class I; CII, class II; MT, mitochondrial; LeER, L. esculentum endoplasmic reticulum. HSC-70-1 represents the BT013586 sequence. The gene sequences of the ascorbate peroxidase (APX) family members present on the microarray were annotated according to Najami et al. (2008) as follows: BM4119001 (SlAPX1), BG626096 (SlAPX2), BM410706 (SlAPX3), BG630221 (SlAPX5), AI775047 and BI208755 were annotated as SlAPX4-like and SlAPX6-like genes because of 89% and 84% identity to the DQ131130 and DQ029334 sequences, respectively, and AF413573 as SlTAPX. Affy ID numbers for all the genes that do not appear in either Table 1 or Supplementary Table S3 are as follows: AtHSC70-1, Les.4819.1.S1_at; SlAPX1, Les.247.3.S1_at; SlAPX2, Les.247.1.S1_a_at; SlAPX4, LesAffx.14867.1.S1_at; SlAPX5, Les.1230.1.A1_at; SlAPX6, LesAffx.25588.1.S1_s_at; SlTAPX, Les.2999.1.S1_at; LeCBF1, Les.124.1.S1_at; LeDREB2, Les.3984.1.S1_at; LeDREB3, Les.3379.1.S1_at.
Fig. 5.
Fig. 5.
RT-PCR analysis of the steady-state transcript levels of selected TDFs. Expression levels were tested using RNA extracted from maturing microspores (5 and 3 d before anthesis; A-5 and A-3, respectively) of at least 100 flowers, derived from plants of cv. 3017 and cv. 3042, which had been either kept under control conditions (C) or exposed to HS (2 h at 43–45 °C). Expression values were determined by semi-quantitative RT-PCR using TDF-specific primers and at least three biological replicates. Several dilutions of template cDNA were tested in order to ensure that gene amplification was in the linear range, and expression levels are compared with the expression of the 18S gene (accession X51576).

Similar articles

Cited by

References

    1. Aloni B, Peet M, Pharr M, Karni L. The effect of high temperature and high atmospheric CO2 on carbohydrate changes in bell pepper (Capsicum annuum) pollen in relation to its germination. Physiologia Plantarum. 2001;112:505–512. - PubMed
    1. Altschul SF, Gish W, Miller W, Myers EW, Lipman DJ. Basic local alignment search tool. Journal of Molecular Biology. 1990;215:403–410. - PubMed
    1. Bao YM, Wang JF, Huang J, Zhang HS. Cloning and characterization of three genes encoding Qb-SNARE proteins in rice. Molecular Genetics and Genomics. 2008;279:291–301. - PubMed
    1. Baniwal SK, Bharti K, Chan KY, et al. Heat stress response in plants: a complex game with chaperones and more than twenty heat stress transcription factors. Journal of Biosciences. 2004;29:471–487. - PubMed
    1. Becker JD, Boavida LC, Carneiro J, Haury M, Feijó JA. Transcriptional profiling of Arabidopsis tissues reveals the unique characteristics of the pollen transcriptome. Plant Physiology. 2003;133:713–725. - PMC - PubMed

Publication types

MeSH terms