. 2009 Oct;20(10):2154-61.
doi: 10.1681/ASN.2008090944. Epub 2009 Jul 23.

Hypotonicity-induced Renin exocytosis from juxtaglomerular cells requires aquaporin-1 and cyclooxygenase-2

Affiliations

Hypotonicity-induced Renin exocytosis from juxtaglomerular cells requires aquaporin-1 and cyclooxygenase-2

Ulla G Friis et al. J Am Soc Nephrol. 2009 Oct.

Abstract

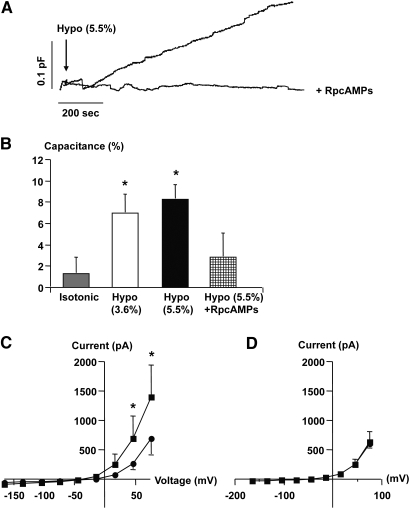
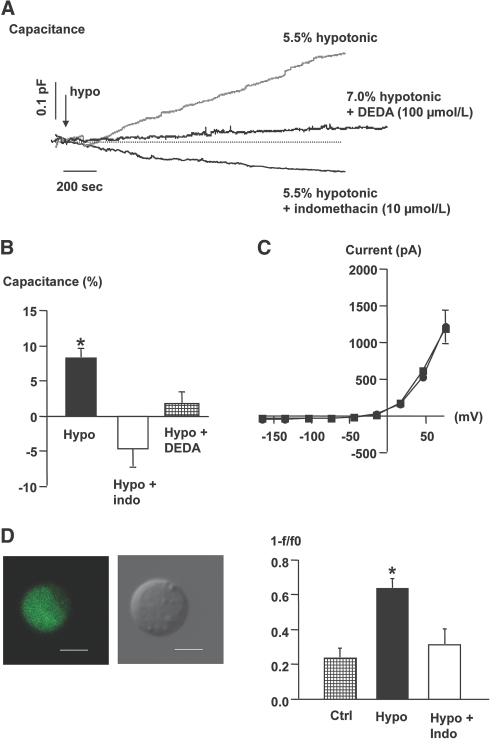
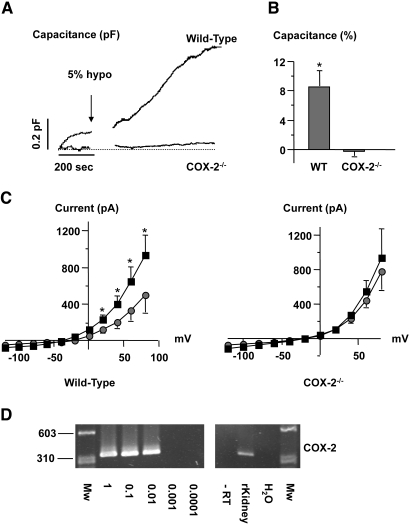
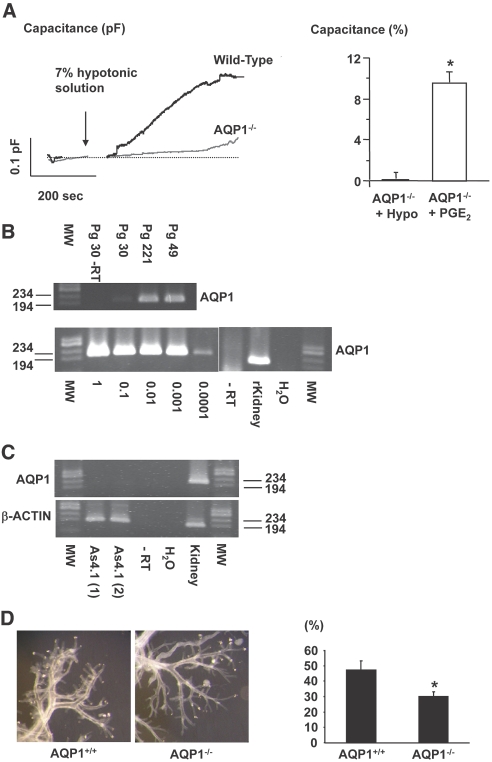
The mechanism by which extracellular hypotonicity stimulates release of renin from juxtaglomerular (JG) cells is unknown. We hypothesized that osmotically induced renin release depends on water movement through aquaporin-1 (AQP1) water channels and subsequent prostanoid formation. We recorded membrane capacitance (C(m)) by whole-cell patch clamp in single JG cells as an index of exocytosis. Hypotonicity increased C(m) significantly and enhanced outward current. Indomethacin, PLA(2) inhibition, and an antagonist of prostaglandin transport impaired the C(m) and current responses to hypotonicity. Hypotonicity also increased exocytosis as determined by a decrease in single JG cell quinacrine fluorescence in an indomethacin-sensitive manner. In single JG cells from COX-2(-/ -) and AQP1(-/ -) mice, hypotonicity increased neither C(m) nor outward current, but 0.1-muM PGE(2) increased both in these cells. A reduction in osmolality enhanced cAMP accumulation in JG cells but not in renin-producing As4.1 cells; only the former had detectable AQP1 expression. Inhibition of protein kinase A blocked the hypotonicity-induced C(m) and current response in JG cells. Taken together, our results show that a 5 to 7% decrease in extracellular tonicity leads to AQP1-mediated water influx in JG cells, PLA(2)/COX-2-mediated prostaglandin-dependent formation of cAMP, and activation of PKA, which promotes exocytosis of renin.


Figures

Figure 1.
Figure 1.
Effect of hypotonic extracellular fluid on cell capacitance (Cm) changes in single rat JG cells. (A) Traces were obtained in single JG cells and show the effect of exposure to hypotonic fluid (arrow, −) on Cm without and with concomitant dialysis with a PKA inhibitor, RpcAMPs (+, 5 μmol/L). (B) The columns display average changes of Cm in response to hypotonic stimuli (Hypo) with and without intracellular RpcAMPs ± SEM. *P ≤ 0.05 at t = 0 versus t = 10 min. Isotonic: n = 10, Hypo: 3.6%, n = 5; 5.5%, n = 8; Hypo and RpcAMPs: n = 4. (C) The average [current-voltage (I-V)] relationship was determined immediately after the whole-cell configuration was obtained (filled circles). The measurement was repeated 10 min after introduction of a hypotonic stimulus (filled squares). *P ≤ 0.05 at t = 0 versus t = 10 min. (D) Average (I-V) relationship in JG cells measured immediately after the whole-cell configuration was obtained and after 10 min with RpcAMPs.
Figure 2.
Figure 2.
(A) Results from a single experiment where rat renal cortical cells enriched in JG cells were mounted in columns and superfused with rapid collections of superfusate and subsequent measurement of renin concentration. A decrease in superfusate osmolality (−10 mOsmol/kg; open squares) and a mock change (filled circles) was introduced (arrow). (B) Renin release from superfused renal cortical cells enriched in JG cells at 300 s after a change in superfusion fluid to a superfusate with a lower osmolality (Hypo) or the same osmolality (isotonic). Values are mean ± SEM; n = 4 separate experiments. (C) Accumulation of cAMP in rat renal cortical cells enriched in JG cells. Cells were allowed to settle for 3 h and then medium was changed to media with reduced osmolality (Hypo, −5, 10, and 20%) as indicated. All media contained the phosphodiesterase inhibitor IBMX (0.1 mmol/L), n = 6 separate experiments with two wells assigned per condition in one experiment. *P ≤ 0.05 ANOVA and post hoc Dunnetts multiple comparison test.
Figure 3.
Figure 3.
(A) Recordings were obtained in single JG cells and show the effect of exposure to hypotonic fluid (arrow, −) on Cm without and with concomitant exposure of the cell to the COX inhibitor indomethacin (10 μmol/L) and a PLA2 inhibitor (DEDA) at 100 μmol/L. (B) The columns display average changes of Cm in response to a hypotonic stimulus (n = 8), a hypotonic stimulus with indomethacin (n = 4), and a hypotonic stimulus with DEDA ± SEM, n = 4. *P ≤ 0.05 at t = 0 versus t = 10 min. (C) The average current-voltage relationship was measured immediately after the whole-cell configuration was obtained (circles). The measurement was repeated 10 min after introduction of a hypotonic stimulus in cells exposed to indomethacin (squares), n = 4. (D) Direct visualization of renin release in single, isolated JG cells. Micrographs display confocal fluorescence image of a quinacrine-stained live JG cell (left) and the same cell as observed by phase-contrast microscopy (right). Bars represent 5 μm. The renin release rate was calculated as the ratio between start fluorescence (F0) and fluorescence after 40 frames (F). Data are shown as 1 − F/F0. The columns show change in quinacrine fluorescence in control cells (n = 6), in cells exposed to an acute reduction in extracellular osmolality (7%) in the absence (n = 5) and in the presence of indomethacin (10 μmol/L, n = 6). Values are mean ± SEM. *P ≤ 0.05 versus control.
Figure 4.
Figure 4.
(A) Recordings were obtained in mouse JG cells and show the effect of hypotonic fluid (5%, arrow) on Cm in a single cell isolated from a C57Bl/6 wild-type mouse and a mouse with targeted deletion of COX-2 (COX-2−/−). (B) Columns display mean ± SEM changes of Cm in response to hypotonic stimuli in single JG cells isolated from C57Bl/6 wild-type mice (n = 4) and mice with targeted deletion of COX-2 (n = 4). *P ≤ 0.05 at t = 0 versus t = 10 min. (C) Left: The average (I-V) relationship was measured immediately after the whole-cell configuration was obtained in all JG cells from wild-type mice (filled circles). The measurement was repeated 10 min after introduction of a hypotonic stimulus (filled squares). Right: The average (I-V) relationship was measured immediately after the whole-cell configuration was obtained in all JG cells from COX-2−/− mice (filled circles). The measurement was repeated 10 min after introduction of a hypotonic stimulus (filled squares). (D) PCR amplification of cDNA from single, sampled JG cells for COX-2. Negative controls were omission of reverse transcriptase (−RT) and water instead of cDNA. Size marker is φX174DNA/HaeIII fragments.
Figure 5.
Figure 5.
(A) The recording shows Cm in a single JG cell that was obtained from a COX-2−/− mouse and stimulated by PGE2 (0.1 μmol/L) (arrow). The right panel displays average changes of Cm in response to PGE2 in JG cells from COX-2−/− mice ± SEM. *P ≤ 0.05 at t = 0 versus t = 10 min (n = 5). (B) The recordings show Cm in single JG cells exposed to hypotonicity with and without an inhibitor of PGT, bromcresol green, in the bath fluid (30 μmol/L). Right panel displays average changes of Cm in response to hypotonicity (Hypo) with and without bromcresol green ± SEM. *P ≤ 0.05 at t = 0 versus t = 10 min, n = 5. (C) PCR amplification of serially diluted cDNA from single, sampled JG cells for PGT and OATP-D. Negative controls were omission of reverse transcriptase and amplification (−RT) and water instead of cDNA. Size marker is φX174DNA/HaeIII fragments.
Figure 6.
Figure 6.
(A) Original traces of Cm recordings in single JG cells obtained from an AQP1 wild-type mouse and an AQP1−/− littermate mouse subjected to a hypotonic stimulus (arrow). Right panel displays average changes ± SEM of Cm in JG cells from AQP1−/− mice in response to a hypotonic stimulus (+Hypo, n = 4) and to PGE2 (0.1 μmol/L, n = 5) *P ≤ 0.05 at t = 0 versus t = 10 min. (B) PCR amplification of cDNA from microdissected mouse preglomerular vasculature (upper) and single, sampled JG cells for AQP1 (lower). “Pg” denotes preglomerular vasculature. Segments of cortical radial arteries with afferent arterioles were dissected. Numbers are the amount of vascular branching points contained in each preparation. Negative controls were omission of reverse transcriptase (−RT) and water instead of cDNA. Serially diluted cDNA from sampled JG cells (1 = cDNA from 1 JG cell) was amplified for AQP1 (lower). Size marker is φX174DNA/HaeIII fragments. (C) PCR amplification of cDNA from As4.1 cells for AQP1 and β-actin. Negative controls were omission of reverse transcriptase (−RT) and addition of water instead of cDNA. Size marker is φX174DNA/HaeIII fragments. (D) Microphotos display microdissected renal vascular trees from acid-macerated kidneys harvested from AQP1 wild-type and knockout mice. Columns show the proportion of afferent arterioles containing JG cells (in %) in wild-type and AQP1 knockout mice. Columns show mean ± SEM, n = 6. *P < 0.05.

Similar articles

Cited by

References

    1. Frederiksen O, Leyssac PP, Skinner SL: Sensitive osmometer function of juxtaglomerular cells in vitro. J Physiol (Lond) 252: 6669–6679, 1975 - PMC - PubMed
    1. Skøtt O: Do osmotic forces play a role in renin secretion? Am J Physiol 255: F1–F10, 1988 - PubMed
    1. Kurtz A, Schweda F: Osmolarity-induced renin secretion from kidneys: evidence for readily releasable renin pools. Am J Physiol Renal Physiol 290: F797–F805, 2006 - PubMed
    1. Toma I, Kang JJ, Sipos A, Vargas S, Bansal E, Hanner F, Meer E, Peti-Peterdi J: Succinate receptor GPR91 provides a direct link between high glucose levels and renin release in murine and rabbit kidney. J Clin Invest 118: 2526–2534, 2008 - PMC - PubMed
    1. Persson BE, Sakai T, Marsh DJ: Juxtaglomerular interstitial hypertonicity in Amphiuma: Tubular origin-TGF-signal. Am J Physiol 254: F445–F449, 1988 - PubMed

Publication types