. 2009 Aug;175(2):786-98.
doi: 10.2353/ajpath.2009.081034. Epub 2009 Jul 23.

Infiltrating CTLs in human glioblastoma establish immunological synapses with tumorigenic cells

Affiliations

Infiltrating CTLs in human glioblastoma establish immunological synapses with tumorigenic cells

Carlos Barcia Jr et al. Am J Pathol. 2009 Aug.

Abstract

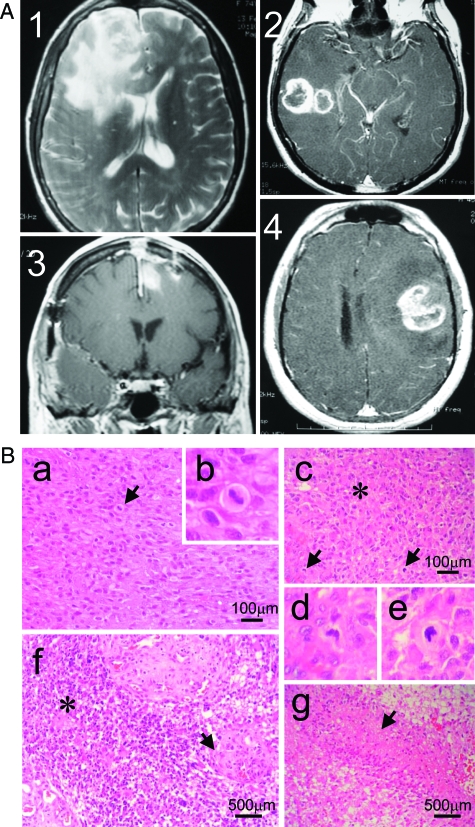
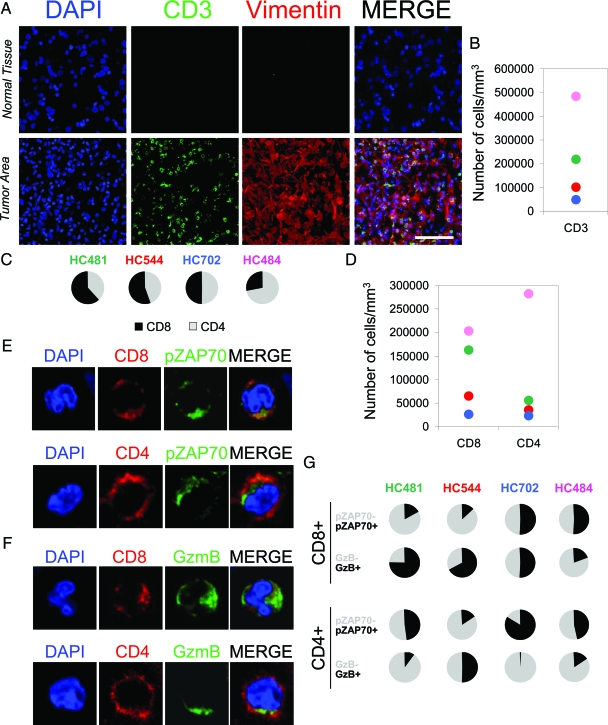
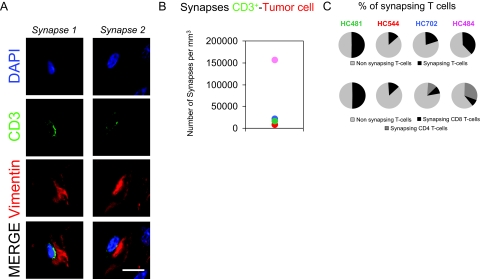
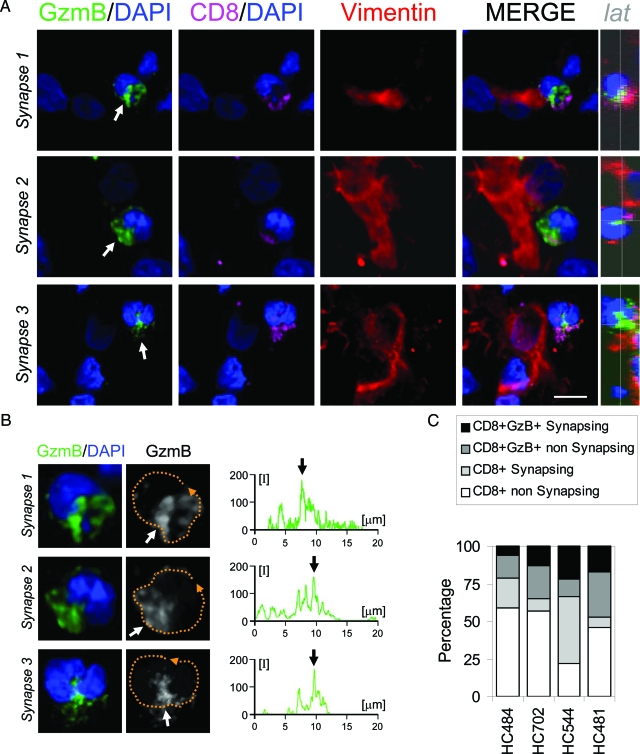
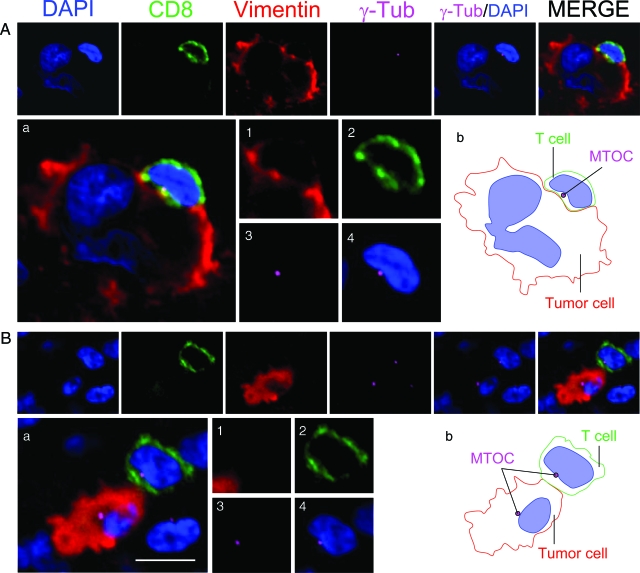
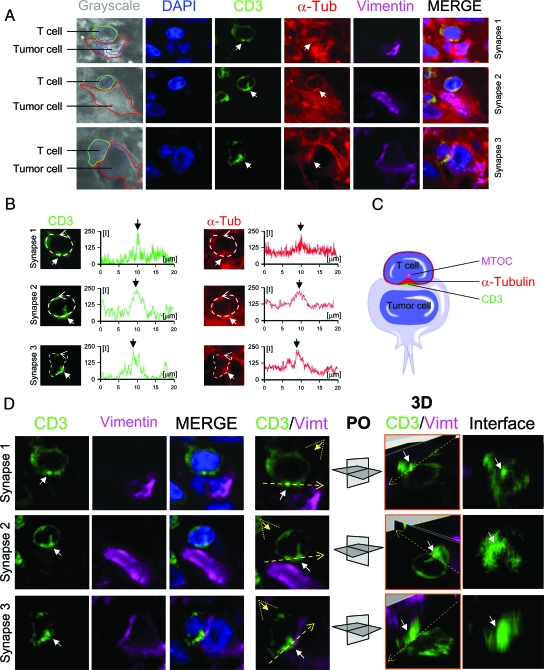
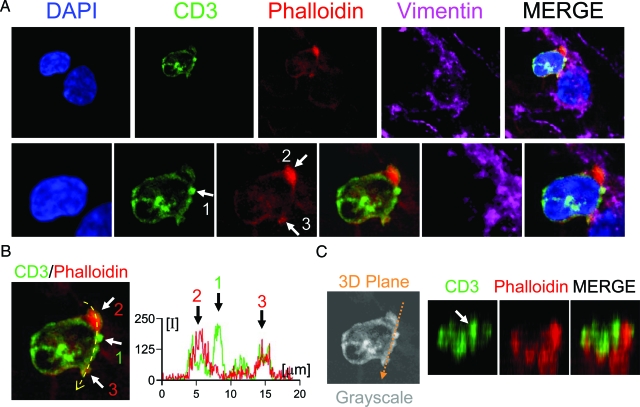
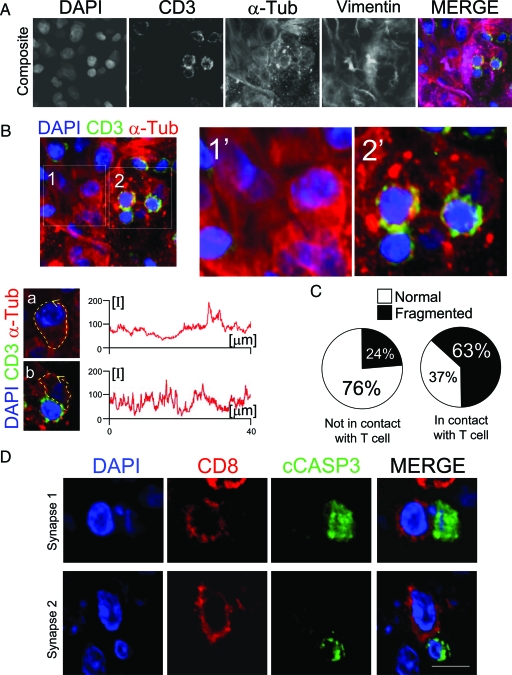
The immunological synapse between T cells and tumor cells is believed to be important for effective tumor clearance. However, the immunological synapse has never been imaged or analyzed in detail in human tissue. In this work, intercellular interactions between T cells and tumor cells were analyzed in detail in human glioblastoma. After characterization of the population of infiltrating T cells by multiple immunofluorescence staining and stereological quantification, the microanatomy of T cell-tumor cell intercellular communication was analyzed in detail using confocal microscopy and three-dimensional rendering. Cytotoxic T lymphocytes that infiltrated human glioblastoma underwent rearrangement when in contact with tumor cells, to form a three-dimensional structure in the intercellular contact area; this was characterized by microclusters of the CD3/TCR complex, re-arrangement of the cytoskeleton, and granzyme B polarization. In addition, such T cell-targeted cells show fragmentation of the microtubular system and increased expression levels of cleaved caspase 3, which suggests that cytotoxic T lymphocytes likely provoke changes in tumor cells and subsequently induce cell death. These results show that the formation of the cytotoxic T lymphocyte immunological synapse occurs in human tissue and may be relevant for the effective immune-mediated clearance of tumorigenic cells, therefore opening up new avenues for glioblastoma immunotherapy.


Figures

Figure 1
Figure 1
The four cases analyzed show typical features of GBM. A: MRI of the four cases of GBM before surgery. A single tumor was located in the frontal lobe in HC484 (1) and HC481 (3), and in the temporal lobe in HC702 (2), while case HC544 (4) presented two tumors, one in the right temporal lobe and a small one in the left frontal parasagittal area. The compression of the ventricles was evident in cases 1, 3, and 4. B: Brain Tumors presented a characteristic GBM morphology. Sections stained with H&E showed marked cellularity with hyperchromatism and pleomorphism (picture a from case 1), with aberrant mitosis (indicated by arrows in pictures a and c from cases 1 and 2, respectively). Higher magnification of the mitosis is depicted in b, d, and e). Sections also showed gemistocytic differentiation (asterisk in picture c and f from cases 2 and 3, respectively), gomeruloid vessels (arrow in f) and necrotic palisades (arrow in picture g from case 4).
Figure 2
Figure 2
Tumor areas are infiltrated by T cells. A: Confocal pictures show normal brain tissue and a brain tumor area stained by DAPI (nuclei) as a counterstaining (blue), CD3 (green), and vimentin (red). The MERGE of the three channels is also shown. Brain tumor areas, detected by the presence of vimentin+ cells, were specifically infiltrated by CD3+ T cells (green). Scale bar = 100 μm. B: Stereological estimation of the number of infiltrated CD3+ T cells by mm3. C: Percentage of CD8+ and CD4+ T cells infiltrated in the tumor areas of all four cases studied. D: Stereological estimation of the density of infiltrated CD8+ and CD4+ cells in the tumor areas. E, F, and G: Representation of the characterization of tumor infiltrated T cells. The confocal pictures in E and F illustrate the staining for CD8 or CD4 (red) combined with GzmB or pZAP70 (green) and DAPI as a counterstaining (blue). The graphs in G show the percentages of CD8+GzmB+, CD8+GzmB, CD8+pZAP70+, and CD8+pZAP70, and the percentages of CD4+GzmB+, CD4+GzmB, CD4+pZAP70+, and CD4+pZAP70.
Figure 3
Figure 3
T cells establish immunological synapses with tumorigenic cells. A: Confocal pictures of two CD3+ T cells synapsing with a tumor cell (synapse 1 and 2). Confocal images represent 0.5-μm optical sections shown in the three different channels: DAPI nuclear staining (blue), CD3+ T cells (green), and vimentin for tumor cells (red). In the merged images, CD3+ T cells are observed in contact with tumor cells. Scale bar = 15 μm. B: Estimation of the number of synapses between CD3+ T cells and vimentin+ tumor cells per mm3 formed in the four cases studied. C: The percentage of T cells (CD3+, CD8+, or CD4+) establishing synapses.
Figure 4
Figure 4
Polarization of GzmB toward tumor cells in CTL. Panel A illustrates three synapses between a CD8+ T cell and a human GBM tumor cell. Confocal images of GzmB (green), CD8 (magenta), and vimentin (red) combined with DAPI as a nuclear counterstaining (blue). The overlapping of all channels is also shown (MERGE). In the three cases the nuclei (DAPI) present the characteristic indentation toward the tumor cell (arrows in DAPI). GzmB immunoreactivity (green) is observed polarized toward the tumor cell and is located in the region of the nuclear notch (arrows in GzmB/DAPI). CD8 is also found polarized toward the tumor cell (CD8/DAPI). A lateral view of the perpendicular plane of the area of contact is also depicted (lat). Panel B illustrates a higher magnification of the three T cell nuclei analyzed in panel A combined with GzmB. It can be seen in detail that GzmB is located at the nucleus indentation in all three synapses. Measurements of the relative fluorescence were performed along the membrane of the cells (broken orange line) and are represented in the graphs. Maximum fluorescence was oriented to the area of contact and is indicated with an arrow in the three cases analyzed. Panel C shows the quantification of the percentage of CTLs synapsing with tumor cells in all four cases studied. Scale bar = 15 μm.
Figure 5
Figure 5
MTOC is polarized toward tumor cells in CD8+ T cells. Two synapses between a CD8+ T cell and a tumor cell are shown in detail. Each synapse was stained for nuclei (DAPI) (blue), CD8+ T cells (green), vimentin (red), and MTOC (γ-Tub) (magenta). The panels illustrate three synapses between a T cell and a tumor cell. γ-Tub/DAPI and the overlapping of all four channels (MERGE) are also shown for each case. In A, a tumor cell with an aberrant nucleus is contacted by a CD8+ T cell. A magnification of the MERGE is shown in Aa and the CD8+ T cell is shown at higher magnification in images 1–4 [vimentin, (1) CD8 (2), γ-tubulin (3), and γ-tubulin+DAPI(4)]. The CD8+ T cell(2) is establishing a synapsing contact with the tumor cell (1) and the MTOC (γ-Tub)(3) is oriented toward the tumor cell. The MTOC is located in the indentation that the T cell nucleus forms and is oriented toward the intercellular contact (4). Image Ab illustrates a schematic drawing of the intercellular contact. B illustrates another tumor cell contacted by a CD8+ T cell, illustrated in the same way as in A. Magnification of MERGE is shown in Ba. Polarization of the MTOC (γ-Tub) (magenta) toward a tumor cell can be observed in T cell. The MTOC of the tumor cell can also be seen in the same optical plane. Magnification of the T cell is illustrated in images 1–4. The CD8+ T cell (2) in contact with the tumor cell (1) displays its MTOC (3) polarized toward the tumor cell and is also located at the notch formed by the T cell nucleus. (4) A schematic representation of the synapse is illustrated in Bb. Scale bar = 15 μm.
Figure 6
Figure 6
T cells polarize the α-tubulin cytoskeleton and form CD3 central microclusters. Confocal analysis of three synapses between T cells and tumor cells in human GBM is shown in detail. A: Confocal pictures of the immunohistochemistry of CD3 (green), α-tubulin (α-Tub) (red), vimentin (Vimt) (magenta), and DAPI (blue) as a counterstain. In the left column, the interaction between the T cell (CD3) and tumor cell (Vimt) is depicted schematically over the grayscale of α-tubulin staining (grayscale). The confocal images show three cases of synapses where CD3 and α-tubulin present an area of higher density at the center of the intercellular contact (white arrows). B: Measurements of the relative fluorescence of CD3 and α-tubulin at the membrane of the three T cells analyzed in (A). In all three cases, CD3 and α-tubulin have a similar pattern of fluorescence, with a higher signal at the center of the intercellular contact (white arrows). C: A schematic representation of the interaction between the T cell and the tumor cell. D: A three-dimensional study of the three synapses analyzed in A and B. The channels for CD3, vimentin, CD3/vimentin/DAPI (MERGE), and CD3/vimentin (CD3/Vimt) are shown. In the CD3/Vimt column of images, the plane of the interface (broken yellow line) and the angle of vision of the three-dimensional rendering (broken yellow triangle) is depicted. Each stack of images was rendered three dimensionally and clipped at the interface. The white arrow indicates the area of maximum relative fluorescence of CD3. In the column of images 3D/CD3/Vimt, the three-dimensional reconstruction of the three synapses is shown. Two perpendicular planes are illustrated crossing the interface (broken yellow arrow) and the area of maximum fluorescence of CD3 (white arrow). The plane orientation (PO) is depicted for each synapse. The plane of the intercellular contact (interface) is illustrated and the white arrow indicates the cluster of maximum CD3 fluorescence at the center of the interface.
Figure 7
Figure 7
Central and peripheral cluster formation at T cell-Tumor cell synapse. A: A detailed confocal image of a T cell synapsing with a vimentin+ tumor cell. In the top row a 1-μm optical section is shown in four different channels, DAPI for nuclei (blue), CD3 for T cells (green), phalloidin for F-actin (red), and vimentin for tumor cell (magenta). Both nuclei can be observed at the same optical plane. The bottom row illustrates a higher magnification of the T cell–tumor cell synapse. The CD3+ T cell displays an area of high level of fluorescence at the central area of the interface (arrow 1). Phalloidin (F-actin) staining shows higher fluorescence at the periphery of the interface (arrows 2 and 3) demonstrating the en face orientation of the cell membrane. Panel B shows the merge of CD3 and phalloidin channels indicating the CD3 cluster (arrow 1) and F-actin cluster (arrows 2 and 3). The graph illustrates the quantification of the relative fluorescence of CD3 and phalloidin at the interface (indicated by the yellow broken arrow). The maximum peak of CD3 fluorescence is indicated by arrow 1 and the maximum peaks of phalloidin fluorescence are indicated by arrows 2 and 3. (C) illustrates the three dimensional reconstruction of CD3 and F-actin at the plane of the interface (the three-dimensional plane is indicated by the broken orange arrow). The three-dimensional reconstructions revealed a CD3 central cluster surrounded by F-actin ring.
Figure 8
Figure 8
Cells in contact with T cells show fragmentation of the α-tubulin cytoskeleton in tumor cells and expression of cCASP3. A: A confocal analysis of a human GBM region stained to visualize CD3, α-tubulin, and vimentin, with DAPI as a nuclear counterstain. The overlapping of all four channels is shown in MERGE. (B) shows the region but only superposing the channels for DAPI, CD3, and α-tubulin. Two areas of the region are illustrated in detail (1 and 2). Area 1 has no T cells and area 2 has T cells. Images 1′ and 2′ show a higher magnification of areas 1 and 2. The confocal resolution of the images is sufficient to distinguish the different appearance of the α-tubulin cytoskeleton of tumor cells whether or not they are synapsing with T cells. Graphs show the relative fluorescence measurements of α-tubulin cytoskeleton along the cell membrane (broken yellow arrow) of a tumor cell not in contact with T cells (a [cropped from 1]) and a tumor cell in contact with a T cell (b [cropped from 2]). The measurements of the relative fluorescence of α-tubulin in the cell not in contact with T cells (a) shows uniform fluorescence levels, while the tumor cell in contact with a T cell (b) displays broken fluorescence levels. C: The quantification of the percentage of tumor cells that present a cleaved appearance of α-tubulin, whether they are in contact or not with T cells. Pie charts show that tumor cells in contact with T cells present a cleaved α-tubulin cytoskeleton more frequently than the tumor cells not in contact with T cells (63% vs 24%). A total of 167 cells were analyzed for this quantification. D illustrates two CD8+ T cells in contact with a cCASP3+ cell. The top row shows a CD8+ T cell in contact with a cCASP3+ cell displaying a fragmented nucleus. The bottom row illustrates a T cell in contact with a cCASP3+ cell showing a condensed and reduced nucleus. Scale bar = 15 mm.

Similar articles

Cited by

References

    1. Bossi G, Griffiths GM. CTL secretory lysosomes: biogenesis and secretion of a harmful organelle. Semin Immunol. 2005;17:87–94. - PubMed
    1. Stinchcombe JC, Bossi G, Booth S, Griffiths GM. The immunological synapse of CTL contains a secretory domain and membrane bridges. Immunity. 2001;15:751–761. - PubMed
    1. Stinchcombe JC, Griffiths GM. The role of the secretory immunological synapse in killing by CD8+ CTL. Semin Immunol. 2003;15:301–305. - PubMed
    1. Barcia C, Thomas CE, Curtin JF, King GD, Wawrowsky K, Candolfi M, Xiong WD, Liu C, Kroeger K, Boyer O, Kupiec-Weglinski J, Klatzmann D, Castro MG, Lowenstein PR. In vivo mature immunological synapses forming SMACs mediate clearance of virally infected astrocytes from the brain. J Exp Med. 2006;203:2095–2107. - PMC - PubMed
    1. Combs J, Kim SJ, Tan S, Ligon LA, Holzbaur EL, Kuhn J, Poenie M. Recruitment of dynein to the Jurkat immunological synapse. Proc Natl Acad Sci USA. 2006;103:14883–14888. - PMC - PubMed

Publication types

MeSH terms