. 2009 Aug 21;325(5943):1001-5.
doi: 10.1126/science.1176676. Epub 2009 Jul 23.

Bcl6 mediates the development of T follicular helper cells

Affiliations

Bcl6 mediates the development of T follicular helper cells

Roza I Nurieva et al. Science. .

Abstract

A fundamental function of CD4+ helper T (T(H)) cells is the regulation of B cell-mediated humoral immunity. Development of T follicular helper (T(FH)) cells that provide help to B cells is mediated by the cytokines interleukin-6 and interleukin-21 but is independent of TH1, TH2, and TH17 effector cell lineages. Here, we characterize the function of Bcl6, a transcription factor selectively expressed in T(FH) cells. Bcl6 expression is regulated by interleukin-6 and interleukin-21. Bcl6 overexpression induced T(FH)-related gene expression and inhibited other T(H) lineage cell differentiation in a DNA binding-dependent manner. Moreover, Bcl6 deficiency in T cells resulted in impaired T(FH) cell development and germinal center reactions, and altered production of other effector T cell subsets. Our data thus illustrate that Bcl6 is required for programming of T(FH) cell generation.


Figures
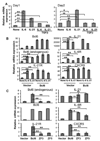
Fig. 1
Fig. 1
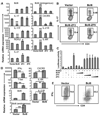
Bcl6 regulates TFH-specific gene expression. (A) Naïve T cells were activated with antibodies to CD3 and CD28, and with or without indicated cytokines for 1 or 2 days. Bcl6 mRNA expression was analyzed by real-time RT-PCR. The graph shows means ± SD. *P < 0.005; **P < 0.001 when comparing IL-6 and IL-6 plus TGFβ to nontreated sample, analysis of variance (ANOVA) test. ++P < 0.001 when comparing IL-21 and IL-21 plus TGFβ to nontreated sample, ANOVA test. (B) Naïve OT-II T cells were activated with antibodies to CD3 and CD28 alone or together with IL-6 or IL-21 and with antibodies to IL-4, IFNγ, and TGFβ, and infected with a bicistronic retrovirus containing internal ribosomal entry site green fluorescent protein (GFP) expressing Bcl6 or a vector control virus. mRNA expression of indicated genes was assessed by real-time RT-PCR. (C) Naïve OT-II T cells were activated with antibodies to CD3 and CD28 alone and infected with retroviruses expressing Bcl6, Bcl6 mutants (ZF3 and ZF5), or vector alone. GFP+ cells were sorted from (B) and (C) and restimulated for 4 hours with antibody to CD3. mRNA expression of indicated genes was analyzed by real-time RT-PCR. The data shown were normalized to the expression of a reference gene, Actb. The graph shows means ± SD. *P < 0.005; **P < 0.001, t test. The data represent at least three independent experiments with consistent results.
Fig. 2
Fig. 2
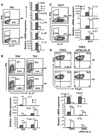
Bcl6 suppresses TH17 and TH1 differentiation. (A and B) Naïve OT-II T cells were activated under TH17 conditions and infected with retroviruses expressing Bcl6, Bcl6 mutants, or vector alone. GFP+ cells sorted by fluorescence-activated cell sorting (FACS) were restimulated with antibody to CD3, and mRNA expression of indicated genes was analyzed by real-time RT-PCR (A). The data shown were normalized to the expression of reference gene Actb. The graph shows means ± SD. *P < 0.005; **P < 0.001 when comparing Bcl6 and ZF3 to vector alone, ANOVA test. ++P < 0.001 when comparing Bcl6 and ZF5 to vector alone, ANOVA test. IL-17–expressing cells were measured by intracellular staining of the sorted GFP+ population (B). Numbers in dot-plot quadrants represent the percentages. (C) EL-4 cells were transfected with a vector containing the firefly luciferase gene under the control of the IL-17 promoter and the CNS2 region, a vector expressing Renilla luciferase, and vectors expressing RORγt, Bcl6 wild-type, various Bcl6 mutants, or vector alone. The firefly luciferase activity was determined and normalized to Renilla luciferase. Values were also normalized to vector alone. The graph shows means ± SD. (D and E) Naïve OT-II T cells were activated under TH1 conditions and infected with the indicated viruses. GFP+ cells were restimulated with antibody to CD3, and mRNA expression of the indicated genes was analyzed by real-time RT-PCR (D). The data shown were normalized to the expression of reference gene Actb. The graph shows means ± SD. *P < 0.005; **P < 0.001, t test. IFNγ expression was analyzed by intracellular staining on FACS-sorted GFP+ cells (E). Numbers in dot-plot quadrants represent the percentages. The data represent at least three independent experiments with consistent results.
Fig. 3
Fig. 3
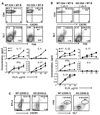
Bcl6 deficiency causes defective T cell differentiation in vitro. Naïve CD4+ T cells from Bcl6−/− mice and their littermate control mice carrying the OT-II TcR transgene were activated under TFH (A), TH0 and TH1 (B), TH17 (C), and Treg (TGFβ or TGFβ with antibodies to IL-4 and IFNγ) (D) conditions. Five days later, cells were assessed for IFNγ and IL-17 production [(A) to (C)] or Foxp3 expression (D) using intracellular staining. Numbers in FACS plot quadrants represent the percentages. mRNA expression of various genes was analyzed by real-time RT-PCR, and the data shown were normalized to the expression of reference gene β-actin. The graph shows means ± SD. P values were calculated using a t test comparing wild-type and Bcl6−/− CD4+ T cells and are indicated as follows: *P < 0.005; **P < 0.001. The experiments were repeated three times with consistent results.
Fig. 4
Fig. 4
Bcl6 is necessary for the generation of TFH cells in vivo. (A and B) Naïve CD4+ cells from wild-type (WT) or Bcl6−/− mice were mixed with WT B cells and transferred into Rag1−/− mice (3 mice per group). The recipient mice were immunized subcutaneously with KLH emulsified in Freund’s complete adjuvant (FCA). In (B), recipient mice were also treated with antibody to IL-4. Seven days after the immunization, germinal center B cells were determined by staining with GL-7, FAS and B220 antibodies, and TFH cells by CD4 and CXCR5 antibodies. Numbers in dot-plot quadrants represent the percentages in gated T and B cells, respectively. Spleen cells from immunized mice were stimulated with the indicated concentration of KLH. Effector cytokines were measured after 4 days of treatment. The graph shows means ± SD. P values were calculated using a t test comparing CXCR5 expression on T cells or GL7/Fas expression on B cells between mice transferred with WT or Bcl6-deficient T and B cells, respectively, and are indicated as follows: *P < 0.005; **P < 0.001. The results are representative of multiple mice (n = 6 per group) from two independent experiments with similar results. (C) Mixed–bone marrow chimeric mice (n = 15) were generated and immunized with KLH in FCA. Spleen cells were stained with antibody to CD45.2 to distinguish WT and Bcl6 knockout compartments and then analyzed for the germinal center B cells and TFH cells. P values were calculated using a t test comparing CXCR5 and GL7/Fas expression between WT and Bcl6-deficient T and B cells, respectively, and are indicated as follows: *P < 0.005; **P < 0.001. The results are a representative of multiple mice (n = 15) from three independent experiments with similar results.

Comment in

Similar articles

Cited by

References

    1. Vinuesa CG, Tangye SG, Moser B, Mackay CR. Nat. Rev. Immunol. 2005;5:853. - PubMed
    1. Fazilleau N, Mark L, McHeyzer-Williams LJ, McHeyzer-Williams MG. Immunity. 2009;30:324. - PMC - PubMed
    1. King C, Tangye SG, Mackay CR. Annu. Rev. Immunol. 2008;26:741. - PubMed
    1. Nurieva RI, et al. Immunity. 2008;29:138. - PMC - PubMed
    1. Vogelzang A, et al. Immunity. 2008;29:127. - PubMed

Publication types

MeSH terms