. 2009 Sep 18;284(38):26070-84.
doi: 10.1074/jbc.M109.013474. Epub 2009 Jul 23.

PARP-1 deficiency increases the severity of disease in a mouse model of multiple sclerosis

Affiliations

PARP-1 deficiency increases the severity of disease in a mouse model of multiple sclerosis

Vimal Selvaraj et al. J Biol Chem. .

Abstract

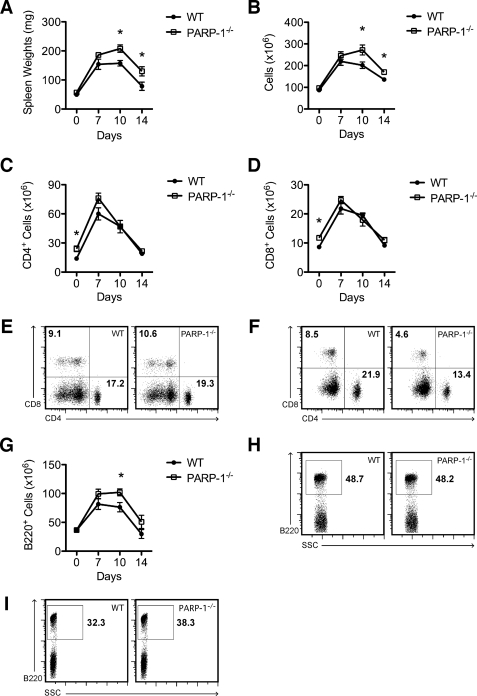
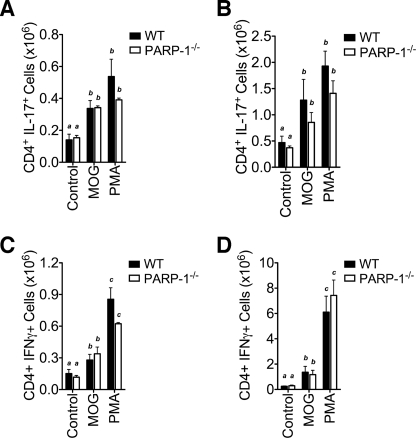
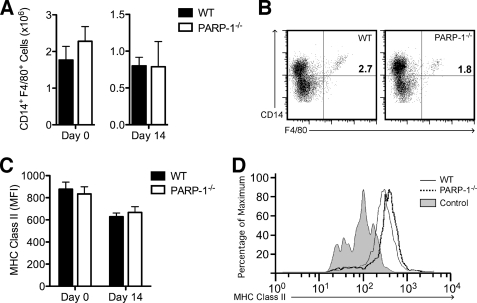
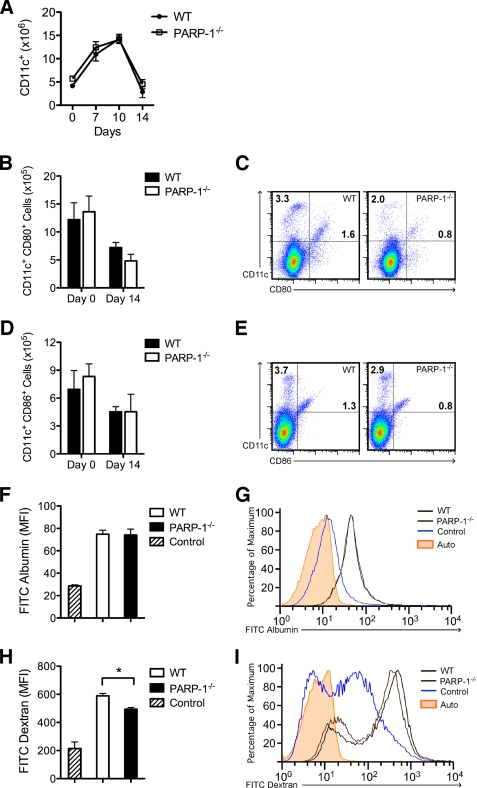
Poly(ADP-ribose) polymerase-1 (PARP-1) has been implicated in the pathogenesis of several central nervous system (CNS) disorders. However, the role of PARP-1 in autoimmune CNS injury remains poorly understood. Therefore, we studied experimental autoimmune encephalomyelitis (EAE), a model for multiple sclerosis in mice with a targeted deletion of PARP-1. We identified inherent physiological abnormalities in the circulating and splenic immune composition between PARP-1(-/-) and wild type (WT) mice. Upon EAE induction, PARP-1(-/-) mice had an earlier onset and developed a more severe EAE compared with WT cohorts. Splenic response was significantly higher in PARP-1(-/-) mice largely because of B cell expansion. Although formation of Th1 and Th17 effector T lymphocytes was unaffected, PARP-1(-/-) mice had significantly earlier CD4+ T lymphocyte and macrophage infiltration into the CNS during EAE. However, we did not detect significant differences in cytokine profiles between PARP-1(-/-) and WT spinal cords at the peak of EAE. Expression analysis of different PARP isozymes in EAE spinal cords showed that PARP-1 was down-regulated in WT mice and that PARP-3 but not PARP-2 was dramatically up-regulated in both PARP-1(-/-) and WT mice, suggesting that these PARP isozymes could have distinct roles in different CNS pathologies. Together, our results indicate that PARP-1 plays an important role in regulating the physiological immune composition and in immune modulation during EAE; our finding identifies a new aspect of immune regulation by PARPs in autoimmune CNS pathology.


Figures

FIGURE 1.
FIGURE 1.
EAE in PARP-1−/− mice. A, EAE progression measured by clinical scores in PARP-1−/− and WT mice. PARP-1−/− mice developed an earlier and more severe EAE compared with WT cohorts. Mean disease severity scores were significantly higher on Days 11–17 in PARP-1−/− mice (p < 0.05, n = 30). B, body weight changes during EAE progression in PARP-1−/− and WT mice. PARP-1−/− mice had a higher base-line body weight but underwent increased weight loss during EAE progression, which was significantly different at Days 13 and 15 compared with WT cohorts (p < 0.05, n = 30). C, survival percentages of PARP-1−/− and WT mice during EAE progression. An earlier incidence and higher rate of mortality was seen in PARP-1−/− mice compared with WT mice. At the end of the study, survival rates were 86.7% for PARP-1−/− and 93.3% for WT mice.
FIGURE 2.
FIGURE 2.
Lymphocyte response during EAE in PARP-1−/− mice. A, changes in spleen weights during EAE in PARP-1−/− and WT mice. After MOG-CFA immune challenge, spleen weights of PARP-1−/− mice increased significantly compared with WT cohorts at Day 10 and Day 14 (p < 0.05, n = 8). B, changes in splenocyte numbers during EAE in PARP-1−/− and WT mice. Corresponding to spleen weight increase, spleen cellularity also increased significantly in PARP-1−/− compared with WT mice at Day 10 and Day 14 (p < 0.05, n = 8). C, CD4+ T lymphocytes in the spleen. Non-immunized PARP-1−/− mice (Day 0) had a significantly higher number of CD4+ cells in the spleen compared with WT (p < 0.05, n = 8). However, after MOG-CFA immune challenge, CD4+ cells in the spleen were not significantly different between PARP-1−/− and WT mice. D, CD8+ T lymphocytes in the spleen. Similar to CD4+ T lymphocytes, non-immunized PARP-1−/− mice had a significantly higher number of CD8+ cells in the spleen compared with WT (p < 0.05, n = 8). However, after MOG-CFA immune challenge, CD8+ cells in the spleen were not significantly different between PARP-1−/− and WT mice. E, representative scatter plots showing splenic CD4+ and CD8+ T lymphocyte proportions in non-immunized (Day 0) PARP-1−/− and WT mice. Associated absolute CD4+ and CD8+ cell numbers from these percentages in the PARP-1−/− spleen were significantly higher compared with WT cohorts. F, representative scatter plots showing splenic CD4+ and CD8+ T lymphocyte percentages at Day 10 of EAE in PARP-1−/− and WT mice. Although the percentages appear drastically different between PARP-1−/− and WT mice, absolute CD4+ and CD8+ cell numbers were not significantly different because of the increase in overall spleen cellularity. G, B220+ B lymphocytes in the spleen. Unlike CD4+ or CD8+ T lymphocytes, the B cell numbers in non-immunized PARP-1−/− spleens were not different compared with WT. However, after MOG-CFA immune challenge, the expansion of B220+ cells in the PARP-1−/− spleen was higher compared with WT mice and was statistically significant at Day 10 (p < 0.05, n = 8). H, representative scatter plots showing splenic B220+ B lymphocyte proportions in non-immunized PARP-1−/− and WT mice. There were no differences in base-line B cell numbers between PARP-1−/− and WT mice. I, representative scatter plots showing splenic B220+ B lymphocyte proportions at Day 10 of EAE in PARP-1−/− and WT mice. The percentages and associated absolute B cell numbers in the PARP-1−/− spleen were significantly higher compared with WT cohorts.
FIGURE 3.
FIGURE 3.
MOG-specific Th17 and Th1 polarization during EAE in PARP-1−/− mice. A, IL-17-producing CD4+ T cells at Day 7 after MOG-CFA immunization. Although the mean number of Th17 cells significantly increased after in vitro stimulation with MOG and phorbol myristyl acetate (PMA), there were no differences between the numbers of Th17 cells generated by PARP-1−/− and WT CD4+ T cell populations collected from the spleen and lymph nodes (n = 7). B, IL-17-producing CD4+ T cells at Day 10 after MOG-CFA immunization. Similar to Day 7, there were no differences in Th17 cell numbers between PARP-1−/− and WT (n = 10). C, IFN-γ-producing CD4+ T cells at Day 7 after MOG-CFA immunization. Although the mean number of Th1 cells significantly increased after in vitro stimulation with MOG and phorbol myristyl acetate, there were no differences between the mean numbers of Th1 cells generated by PARP-1−/− and WT CD4+ T cell populations collected from the spleen and lymph nodes (n = 7). D, IFNγ-producing CD4+ T cells at Day 10 after MOG-CFA immunization. The number of CD4+ T cells polarizing to a Th17 subtype dramatically increased compared with Day 7. However, there were no differences in mean Th1 cell numbers generated by PARP-1−/− and WT CD4+ T cells (n = 10).
FIGURE 4.
FIGURE 4.
Splenic macrophages during EAE in PARP-1−/− mice. A, macrophage numbers in the spleen. An estimation of CD14+F4/80+ cells in the spleen at Day 0 and Day 14 of EAE showed no differences between PARP-1−/− and WT mice (n = 6). B, representative scatter plots from Day 14 spleen showing proportions of CD14+F4/80+ cells in WT and PARP-1−/− mice. The significantly higher cell numbers in the PARP-1−/− spleens compared with WT negated the decrease in PARP-1−/− macrophage proportions observed in this scatter plot. C, MHC Class II expression in PARP-1−/− and WT macrophages. There were no differences in the mean fluorescence intensity (MFI) levels of MHC Class II expression in PARP-1−/− and WT mice when compared at Day 0 and Day 14 (n = 6/group). D, representative histogram showing nonsignificant differences in MHC Class II levels in PARP-1−/− and WT mice at Day 14, both with a clinical EAE score of 4. Isotype control is merged as a shaded histogram.
FIGURE 5.
FIGURE 5.
Dendritic cell response and function in PARP-1−/− mice. A, dendritic cell numbers in the spleen. PARP-1−/− mice did not show differences in splenic CD11c+ cells compared with WT during EAE progression (n = 6–8/group). B, dendritic cell maturation indicated by a CD11c+CD80+ subpopulation was not affected in PARP-1−/− mice when examined at Day 0 and Day 14 (n = 6/group). C, representative scatter plots at Day 14 from mice with a clinical EAE score 4 showing the CD11c+ and CD11c+CD80+ subpopulations in the spleen. Associated absolute CD11c+CD80+ cell numbers from these percentages in the PARP-1−/− spleen were not significantly different compared with WT cohorts. D, dendritic cell maturation indicated by a CD11c+CD86+ subpopulation was not affected in PARP-1−/− mice when examined at Day 0 and Day 14 (n = 6/group). E, representative scatter plot at Day 14 from mice with a clinical EAE score 4 showing the CD11c+ and CD11c+CD86+ subpopulations in the spleen. Associated absolute CD11c+CD86+ cell numbers from these percentages in the PARP-1−/− spleen were not significantly different compared with WT cohorts. F, phagocytosis in PARP-1−/− dendritic cells. FITC-albumin uptake estimated as intracellular mean fluorescence intensity (MFI) showed no differences between PARP-1−/− and WT dendritic cells (n = 3/group). Control mean fluorescence intensity was estimated by incubating WT dendritic cells with FITC-albumin at 4 °C. G, representative histogram showing no differences in FITC-albumin uptake between PARP-1−/− and WT dendritic cells. Also shown are histograms for autofluorescence (Auto) and FITC-albumin uptake by a WT control at 4°C (Control). H, macropinocytosis in PARP-1−/− dendritic cells. FITC-dextran uptake estimated as intracellular mean fluorescence intensity showed significant decrease in PARP-1−/− compared with WT dendritic cells (p < 0.05, n = 3/group). Control MFI was estimated by incubating WT dendritic cells with FITC-dextran at 4 °C. I, representative histogram showing an increased uptake in WT dendritic cells compared with PARP-1−/−. Also shown are histograms for autofluorescence and FITC-dextran uptake by a WT control at 4 °C.
FIGURE 6.
FIGURE 6.
CNS lymphocyte infiltrates during EAE progression in PARP-1−/− mice. A, number of CD4+ and CD8+ T lymphocyte infiltrations in the CNS at Day 10 of EAE. PARP-1−/− mice had a significantly higher CD4+ T lymphocyte infiltration compared with WT (p < 0.05, n = 6). B, representative scatter plots showing the increased proportion of CD4+ T lymphocyte infiltration in the PARP-1−/− CNS at day 10. Infiltration of CD8+ T lymphocytes was only minimal at this time point. C, number of CD4+ and CD8+ T lymphocyte infiltration in the CNS at Day 14 of EAE. Differences between mean values for PARP-1−/− and WT mice were not statistically significant for either CD4+ or CD8+ T lymphocytes (n = 8). D, representative scatter plots comparing a WT and PARP-1−/− mouse both with clinical EAE score of 4 at Day 14. E, T regulatory cells in the CNS infiltrates. There were no differences in the number of CD4+CD25+ CNS infiltrates between PARP-1−/− and WT mice at either Day 10 or Day 14 of EAE (n = 5–6/group). F, subset of Th1 cells in the CNS infiltrates. IFNγ-producing CD4+ T lymphocyte numbers were not different between PARP-1−/− and WT mice at Day 14 of EAE (n = 6). G, subset of Th17 cells in the CNS infiltrates. IL-17-producing CD4+ T lymphocyte numbers were not different between PARP-1−/− and WT mice at Day 14 of EAE (n = 6). H, immunohistochemistry for MBP in sections of lumbar spinal cord at Day 14 of EAE. Representative images from a PARP-1−/− and WT mouse both with a clinical EAE score of 4 are shown. The region of infiltrating cells and associated demyelination (loss of MBP) are enlarged for each sample. There was a consistent correlation between demyelination pathology and clinical EAE score in both PARP-1−/− and WT mice. Scale bars indicate 100 μm.
FIGURE 7.
FIGURE 7.
Macrophages, microglia, and neutrophils in the CNS during EAE in PARP-1−/− mice. A, number of CD11b+CD45hi macrophages in the CNS at Day 10 and Day 14 of EAE. PARP-1−/− mice had a significantly higher CD11b+CD45hi cell infiltration compared with WT at Day 10 of EAE (p < 0.05, n = 6). Although the means were different at Day 14, CD11b+CD45hi cell numbers were not different for this time point. B, representative contour plots showing proportions of CD11b+CD45hi and CD11b+CD45lo cells in the CNS at Day 10 of EAE in a PARP-1−/− and WT cohort. Increased percentages of CD11b+CD45hi macrophages and CD11b+CD45lo microglia were seen in the PARP-1−/− CNS compared with WT. C, number of CD11b+CD45lo microglia in the CNS at Day 0, Day 10, and Day 14 of EAE. PARP-1−/− mice had a significantly higher CD11b+CD45lo microglia compared with WT at Day 10 of EAE (p < 0.05, n = 6). Microglia numbers were not significantly different on Day 0 or Day 14 of EAE. D, microglial activation indicated by the expression of CD68. CD11b+CD45lo cells in the CNS expressing CD68 were not different between PARP-1−/− and WT mice at either Day 10 or Day 14 of EAE. E, representative histograms showing microglia (Mg) and macrophage (Mϕ) expression of CD68 in a PARP-1−/− and WT mice, both with a clinical EAE score of 4 at Day 14. There were no differences in CD68 expression in either CD11b+CD45hi or CD11b+CD45lo cells between PARP-1−/− and WT mice. F, immunohistochemistry for Iba1 in sections of lumbar spinal cord at Day 14 of EAE. Representative images from a PARP-1−/− and WT mouse, both with a clinical EAE score of 4 are shown. Region of infiltrating cells (4,6-diamidino-2-phenylindole) and Iba1 positive macrophages and microglia indicate activation-induced overexpression of Iba1 at a similar rate in both PARP-1−/− and WT mice (n = 6). Scale bars indicate 100 μm. G, CNS neutrophil infiltration during EAE in PARP-1−/− and WT mice. There were no differences in Ly6G+ neutrophils in the CNS at Day 10 or Day 14 of EAE between PARP-1−/− and WT cohorts (n = 6). H, representative histograms comparing CNS Ly6G+ cells in PARP-1−/− and WT mice, both with a clinical EAE score of 4. We detected no significant differences in Ly6G+ cell numbers in the absence of PARP-1.
FIGURE 8.
FIGURE 8.
Cytokine and adhesion molecule mRNA expression during EAE in PARP-1−/− mice. A, comparison of relative TNFα mRNA expression (fold-change) at Day 0 and Day 14 (peak of EAE) showed a significant up-regulation at Day 14 in both WT and PARP-1−/− mice (p < 0.05). However, the higher mean in PARP-1−/− mice was not statistically significant. B, comparison of relative IFNγ mRNA expression at Day 0 and Day 14 of EAE showed a significant up-regulation at Day 14 in both WT and PARP-1−/− mice (p < 0.05). Similar to TNFα, mean values were not statistically significant between the two genotypes. C, comparison of relative IL-1β mRNA expression at Day 0 and Day 14 of EAE showed a significant up-regulation at Day 14 in both WT and PARP-1−/− mice (p < 0.05) with no significant differences between the two genotypes. D, comparison of relative IL-2 mRNA expression at Day 0 and Day 14 of EAE again showed a significant up-regulation at Day 14 in both WT and PARP-1−/− mice (p < 0.05) with no significant differences between the two genotypes. E, comparison of relative IL-4 mRNA expression at Day 0 and Day 14 of EAE showed that IL-4 values did not change during EAE in either of the genotypes. F, comparison of relative IL-5 mRNA expression at Day 0 and Day 14 of EAE showed significant up-regulation at Day 14 in both WT and PARP-1−/− mice (p < 0.05) with no differences between the two genotypes. G, comparison of relative IL-10 mRNA expression at Day 0 and Day 14 of EAE showed significant down-regulation at Day 14 in both WT and PARP-1−/− mice (p < 0.05). However, there were no differences between the two genotypes. H, comparison of relative TGFβ mRNA expression at Day 0 and Day 14 of EAE showed a significant up-regulation at Day 14 in either WT or PARP-1−/− mice (p < 0.05) with no differences between the genotypes. I, comparison of relative iNOS mRNA expression at Day 0 and Day 14 of EAE showed significant up-regulation in both WT and PARP-1−/− mice (p < 0.05) at the peak of EAE, but values were not different between PARP-1−/− and WT mice. J, comparison of relative ICAM-1 mRNA expression showed significant up-regulation in both WT and PARP-1−/− mice (p < 0.05) at the peak of EAE (Day 14), but values were not different between the two genotypes. K, comparison of relative VCAM-1 mRNA expression also showed significant up-regulation in both WT and PARP-1−/− mice (p < 0.05) at the peak of EAE (Day 14), but values were not different between PARP-1−/− and WT mice. (Day 0, n = 4; Day 14, n = 5–6).
FIGURE 9.
FIGURE 9.
Expression levels of different PARPs and epigenetic modulators during EAE. A, comparison of relative PARP-1 mRNA expression at Day 0 (control) and Day 14 (peak EAE) showed significant but modest down-regulation of PARP-1 expression at the peak of EAE in WT mice (p < 0.05). B, comparison of relative PARP-2 mRNA expression between PARP-1−/− and WT mice showed no significant changes in mRNA expression during the course of EAE or between the two genotypes. C, in both PARP-1−/− and WT mice, PARP-3 mRNA levels increased significantly at Day 14 compared with Day 0 (p < 0.05). However, no statistically significant differences in PARP-3 mRNA levels were detected between PARP-1−/− and WT mice at these two time points. D, comparison of DNMT1 mRNA levels between Day 0 and Day 14 of EAE showed a significant increase in its expression in WT mice (p < 0.05). Despite the increased severity of EAE in PARP-1−/− mice, their DNMT1 levels remained unchanged at Day 14 of EAE and were significantly lower compared with WT mice at this same time point (p < 0.05). E, in both PARP-1−/− and WT mice, CTCF mRNA levels showed a decrease at Day 14 compared with Day 0. Statistically significant differences in CTCF levels were not detected between PARP-1−/− and WT mice at these two time points (p < 0.05). However, in pairwise comparisons, CTCF levels in PARP-1−/− mice at Day 0 were not different from WT mice at Day 14 (Day 0, n = 4; Day 14, n = 5–6).

Similar articles

Cited by

References

    1. Chambon P., Weill J. D., Mandel P. (1963) Biochem. Biophys. Res. Commun. 11, 39–43 - PubMed
    1. Kim M. Y., Zhang T., Kraus W. L. (2005) Genes Dev. 19, 1951–1967 - PubMed
    1. Amé J. C., Spenlehauer C., de Murcia G. (2004) BioEssays 26, 882–893 - PubMed
    1. Moroni F. (2008) Curr. Opin. Pharmacol. 8, 96–103 - PubMed
    1. Masson M., Niedergang C., Schreiber V., Muller S., Menissier-de Murcia J., de Murcia G. (1998) Mol. Cell. Biol. 18, 3563–3571 - PMC - PubMed

Publication types

MeSH terms