. 2009 Jul;5(7):e1000444.
doi: 10.1371/journal.pcbi.1000444. Epub 2009 Jul 24.

Power efficiency of outer hair cell somatic electromotility

Affiliations

Power efficiency of outer hair cell somatic electromotility

Richard D Rabbitt et al. PLoS Comput Biol. 2009 Jul.

Abstract

Cochlear outer hair cells (OHCs) are fast biological motors that serve to enhance the vibration of the organ of Corti and increase the sensitivity of the inner ear to sound. Exactly how OHCs produce useful mechanical power at auditory frequencies, given their intrinsic biophysical properties, has been a subject of considerable debate. To address this we formulated a mathematical model of the OHC based on first principles and analyzed the power conversion efficiency in the frequency domain. The model includes a mixture-composite constitutive model of the active lateral wall and spatially distributed electro-mechanical fields. The analysis predicts that: 1) the peak power efficiency is likely to be tuned to a specific frequency, dependent upon OHC length, and this tuning may contribute to the place principle and frequency selectivity in the cochlea; 2) the OHC power output can be detuned and attenuated by increasing the basal conductance of the cell, a parameter likely controlled by the brain via the efferent system; and 3) power output efficiency is limited by mechanical properties of the load, thus suggesting that impedance of the organ of Corti may be matched regionally to the OHC. The high power efficiency, tuning, and efferent control of outer hair cells are the direct result of biophysical properties of the cells, thus providing the physical basis for the remarkable sensitivity and selectivity of hearing.


Conflict of interest statement

The authors have declared that no competing interests exist.

Figures

Figure 1
Figure 1. Model.
A) The intracellular space was modeled as an axial conductor with resistance ri per unit length, intracellular voltage, v(x,t), and axial displacement, u(x,t). B) Axial and circumferential forces were assumed to be distributed across the cortical lattice/membrane complex of reference thickness, h, and represented by hoop, T2, and axial, T1, stresses. C) Isochoric deformations were assumed, thus relating the axial and circumferential strains, S1 = −S2/2. D) The motor region of the lateral wall (Zc in panel A) was modeled as composite material consisting of passive elastic and active piezoelectric materials configured in series, with strains summating according to the mixture fraction formula image 
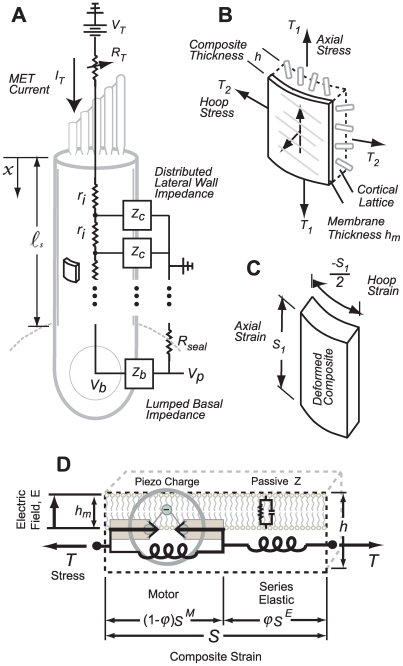
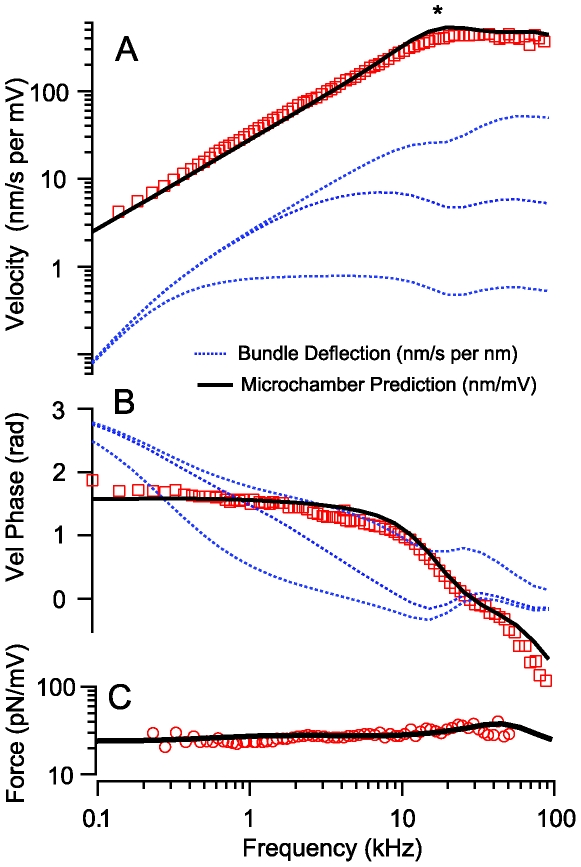
to give the composite strain. The base of the cell was modeled as a simple membrane with conductance and capacitance per unit area (Zb in panel A). Four stimulus conditions were simulated: sinusoidal transduction current injection IT entering the apical pole of the cell, sinusoidal displacement of the hair bundle leading to frequency-dependent MET currents, sinusoidal voltage clamp of the intracellular voltage Vb at the base using a patch pipette and, sinusoidal modulation of the extracellular voltage Vp at the base using a glass microchamber sealed with resistance Rseal around the passive basal pole of the cell. In all simulations, cells were held stationary at formula image and generated force or movement at formula image.
Figure 2
Figure 2. Voltage dependent capacitance and axial stiffness.
A) Model predictions for the nonlinear capacitance based on the Boltzmann piezoelectric distribution compared to data from Kakehata & Santos-Sacchi for a ∼50 micron long OHC under conditions of zero load. The capacitance exhibits a linear component plus a nonlinear (voltage dependent) component. Dashed curves show the effect of varying the piezoelectric coefficient by ±25%. B) The model predicts a parabolic relationship between the nonlinear component of capacitance and the peak isometric force as the membrane potential is traversed from −200 to +130 mV (same cell). All subsequent results are for small (linearized) forces and movements about a membrane potential of −78 mV. C) Compliance predicted by the model (solid line) is shown vs. cell length in comparison to data (symbols) from Frank et al., .
Figure 3
Figure 3. Input capacitance vs. frequency.
A) Input capacitance and B) resistance of two 50 µm long OHCs measured with patch pipettes attached at the base begin to roll-off at high frequencies. Error bars denote one standard deviation of the capacitance at each frequency tested. Solid curves show model results. The capacitance begins to roll off above ∼1 kHz. The roll off is captured by the model due to a loss of space clamp that occurs at higher frequencies. These data were used to estimate the intracellular axial electrical resistance of the cell.
Figure 4
Figure 4. Displacement gain vs. cell length.
Sinusoidal control of the extracellular voltage around the base of OHCs (microchamber configuration) evokes movment proportional to the voltage and dependent upon cell length. Symbols show microchamber data from Frank et al. in comparison to the prediction of the present model (solid black curve, Eq. 18 at base). The same model simulated for voltage clamp conditions (solid blue curve, Eq. 17 at base) predicts voltage clamp data from Ashmore and Santos-Sacchi, . Also shown is the model prediction after increasing the basal membrane conductance by 2.2× (dashed curve, low Zb) to simulate application of Ach in the microchamber configuration. Hence, efferent action lowering Zb is predicted to increase OHC movement gain in the microchamber, but sharply attenuate the gain under physiological stimulation due to short circuit of the base of the cell.
Figure 5
Figure 5. Axial velocity and isometric force vs. frequency.
A) The zero-load velocity gain and B) phase are shown as functions of frequency for an 80 µm long OHC. Symbols replot data from by Frank et al. (nm/s somatic velocity per mV extracellular microchamber voltage), and solid black curves provide the current model predictions, also in the microchamber configuration. The * denotes the OHC displacement corner frequency observed under microchamber conditions, which increases in value for shorter cells. Also shown are model projections for physiological hair bundle displacements (dotted, nm/s somatic velocity per nm of hair bundle displacement). The series of curves (blue dotted) show predictions for various rates of fast MET adaptation associated with the MET adaptation time constant (tT). Note that MET adaptation is predicted to introduce a broad-band phase roll-off and result in OHC velocity that increases with bundle displacement frequencies below 1/τT and becomes relatively flat for frequencies above 1/τT. C) Isometric force generated by the same cell in the microchamber configuration (symbols) is predicted by the same model (solid black curve). Note the corner frequency is much higher under isometric force conditions due to the restriction on cell movement.
Figure 6
Figure 6. Normalized force, power, and efficiency vs. velocity.
Maximum force is predicted to occur under isometric conditions (zero velocity), and maximum velocity is predicted to occur under zero load – both extremes require MET electrical power input but result in zero mechanical power output. The mechanical power output is shown as a function of velocity (solid parabolic curve) along with the electrical power input via the MET (solid red line). Efficiency is the ratio of the two curves (dotted curve) and peaks (*) at a force slightly lower that half of the isometric force and at the impedance-matched load corresponding to a velocity slightly higher than half of the zero-load velocity. This peak occurs at the “impedance matched” load.
Figure 7
Figure 7. Power conversion efficiency.
A) The taxonomy of electrical to mechanical power conversion efficiency delineating regions where input electrical power is lost to series-elastic piezoelectric coupling, OHC stiffness, fluid viscosity, entrained mass, and OHC intracellular axial electrical resistance for a 28 µm long cell. Results are shown under control conditions when the base of the OHC has a high impedance (solid red, cross-hatch, high Zb), and under conditions of low basal impedance associated with the action of efferent neurotransmitter on the base of the OHC (dashed green, diagonal hatch, low Zb). The peak efficiency formula image 
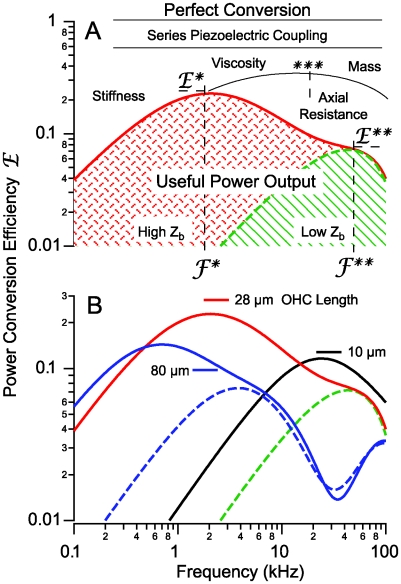
occurs at a best frequency formula image, and shifts down in magnitude and up in frequency with opening of conductive ion channels in the basal cell membrane (formula image, formula image). Hence, shunting of the basal impedance by efferent action on OHCs is predicted to attenuate their power output at best frequency formula image, by well over an order of magnitude. B) The most efficient frequency depends upon cell length. Shorter cells show peak efficiencies at higher frequencies (10 µm) while longer cells show peak efficiencies at lower frequencies (80 µm). These predictions were computed by adjusting the load to be impedance matched at each frequency (peak efficiency load in Fig. 6 denoted by *).
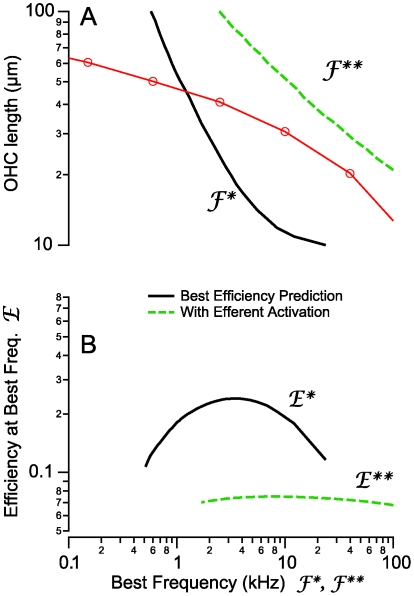
Figure 8
Figure 8. OHC length vs. best frequency.
OHCs vary their length systematically with the place-principle of best frequency sensitivity in the cochlea. A) Anatomical lengths of hair cells in the cochlea (red symbols connected by lines, [78]) are compared to the length predicted by the present model to achieve maximum power conversion efficiency (frequency of peak in Fig. 7). Solid black curves show model predictions for peak efficiencies under control (high Zb) conditions while dashed green curves show predictions during efferent activation (low Zb). B) The model predicts that peak efficiencies vary systematically with OHC length, with cells tuned near 3–4 kHz being the most efficient (B, solid black curve). All cells are predicted to become inefficient when the basal electrical impedance (Zb) is reduced thorough activation of the efferent system (B, dashed green curve).

Similar articles

Cited by

References

    1. Fettiplace R, Hackney CM. The sensory and motor roles of auditory hair cells. Nat Rev Neurosci. 2006;7:19–29. - PubMed
    1. Kemp DT. Stimulated acoustic emissions from within the human auditory system. J Acoust Soc Am. 1978;64 - PubMed
    1. Rhode WS. Observations of the vibration of the basilare membrane in squirrel monkeys using the Mossbauer technique. J Acoust Soc Am. 1971;49 - PubMed
    1. Mountain DC. Changes in endolymphatic potential and crossed olivo cochlear bundle stimulation alter cochlear mechanics. Science. 1980;210:71–72. - PubMed
    1. Davis H. An active process in cochlear mechanics. Hear Res. 1983;9:79–90. - PubMed

Publication types