

Pch2 links chromosome axis remodeling at future crossover sites and crossover distribution during yeast meiosis
- PMID: 19629172
- PMCID: PMC2708914
- DOI: 10.1371/journal.pgen.1000557
Pch2 links chromosome axis remodeling at future crossover sites and crossover distribution during yeast meiosis
Abstract
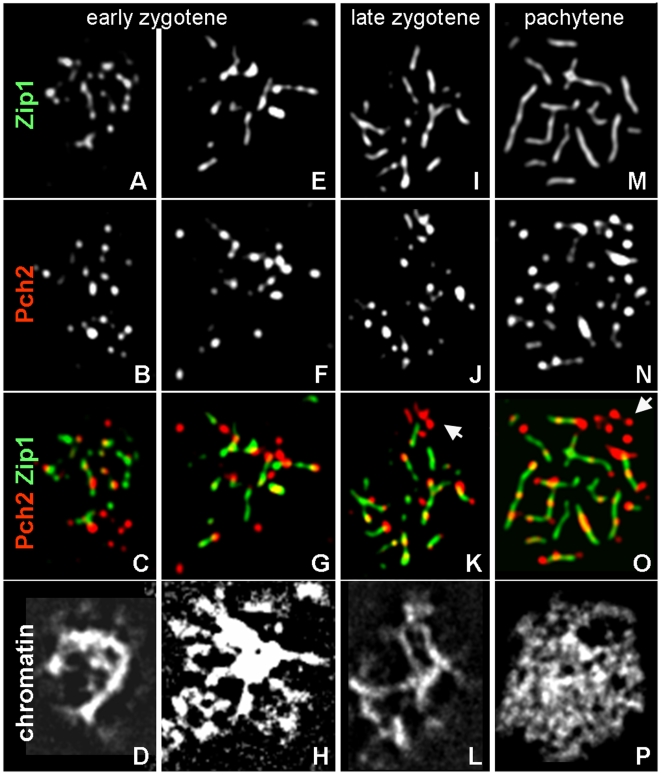
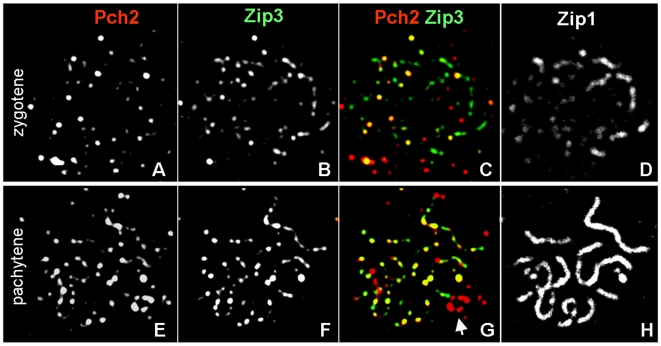
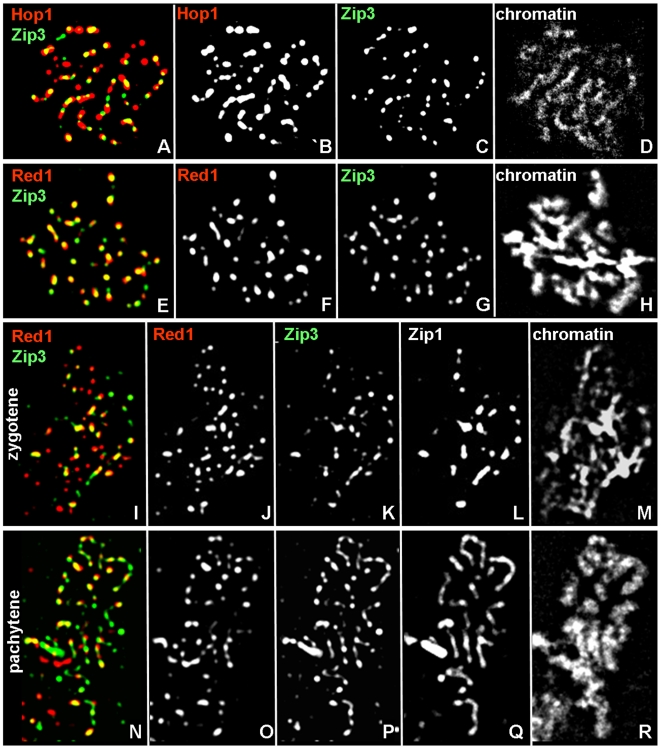
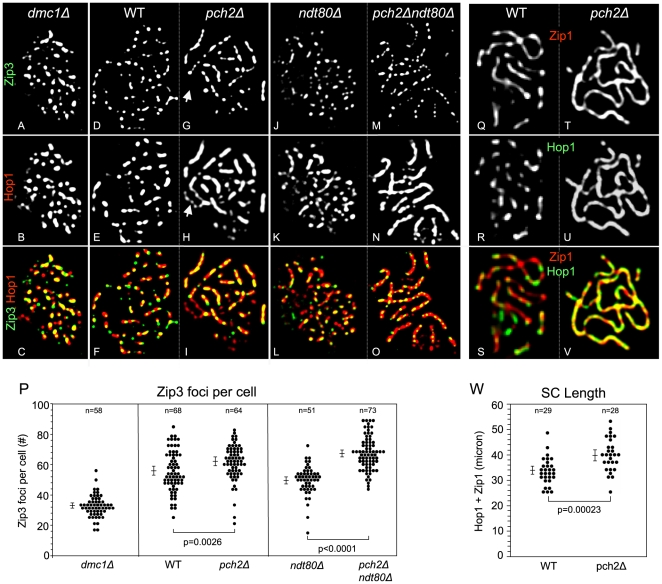
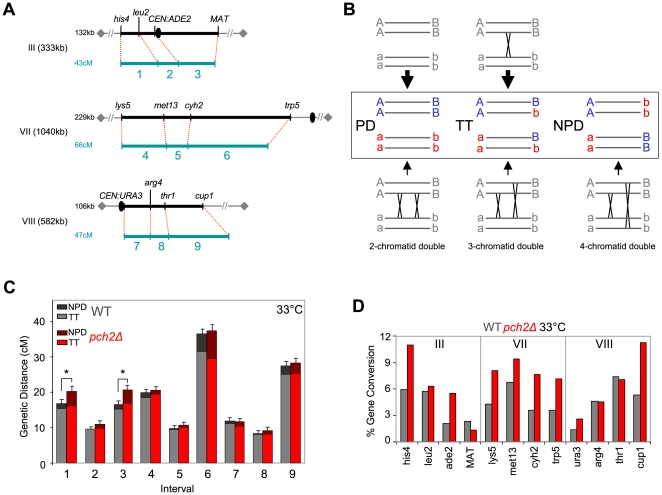
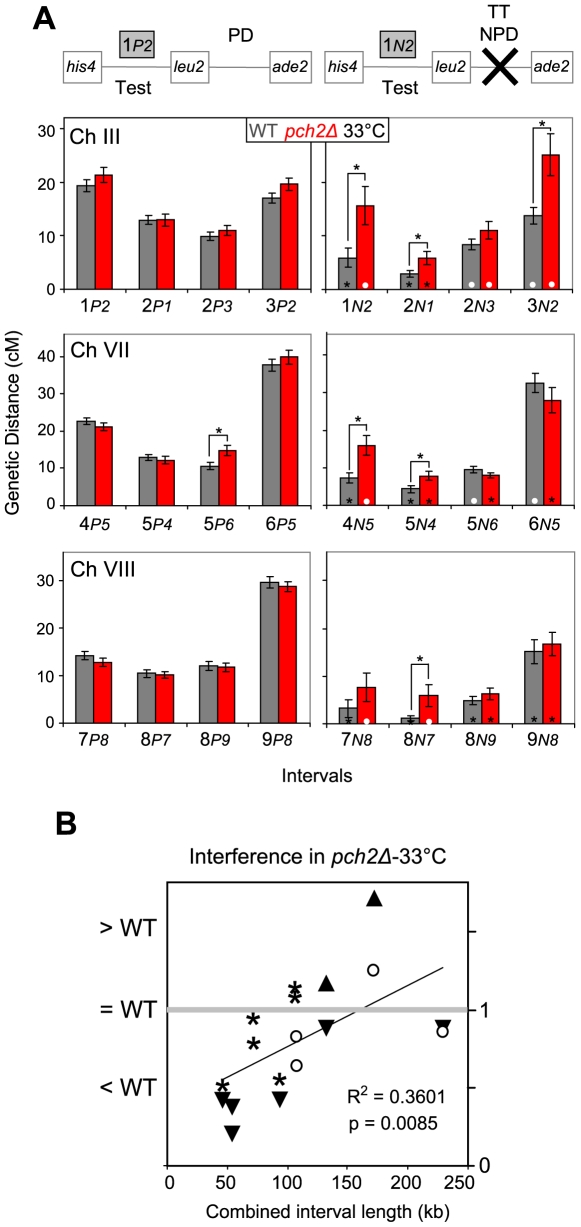
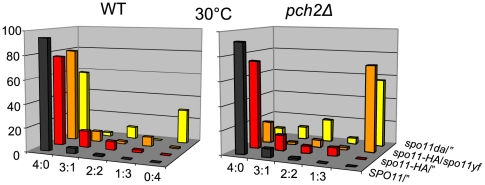
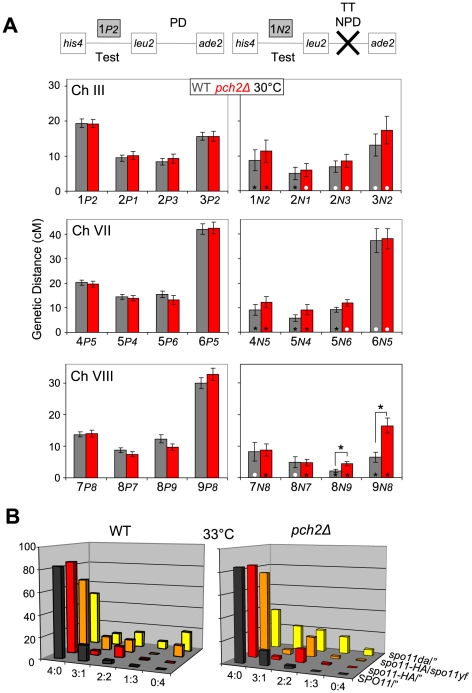
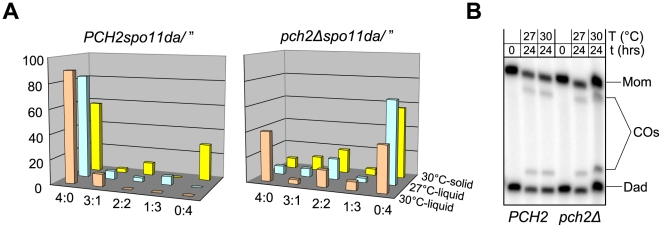
Segregation of homologous chromosomes during meiosis I depends on appropriately positioned crossovers/chiasmata. Crossover assurance ensures at least one crossover per homolog pair, while interference reduces double crossovers. Here, we have investigated the interplay between chromosome axis morphogenesis and non-random crossover placement. We demonstrate that chromosome axes are structurally modified at future crossover sites as indicated by correspondence between crossover designation marker Zip3 and domains enriched for axis ensemble Hop1/Red1. This association is first detected at the zygotene stage, persists until double Holliday junction resolution, and is controlled by the conserved AAA+ ATPase Pch2. Pch2 further mediates crossover interference, although it is dispensable for crossover formation at normal levels. Thus, interference appears to be superimposed on underlying mechanisms of crossover formation. When recombination-initiating DSBs are reduced, Pch2 is also required for viable spore formation, consistent with further functions in chiasma formation. pch2Delta mutant defects in crossover interference and spore viability at reduced DSB levels are oppositely modulated by temperature, suggesting contributions of two separable pathways to crossover control. Roles of Pch2 in controlling both chromosome axis morphogenesis and crossover placement suggest linkage between these processes. Pch2 is proposed to reorganize chromosome axes into a tiling array of long-range crossover control modules, resulting in chiasma formation at minimum levels and with maximum spacing.
Conflict of interest statement
The authors have declared that no competing interests exist.
Figures
Comment in
-
PCH'ing together an understanding of crossover control.PLoS Genet. 2009 Jul;5(7):e1000576. doi: 10.1371/journal.pgen.1000576. Epub 2009 Jul 24. PLoS Genet. 2009. PMID: 19629169 Free PMC article. No abstract available.
Similar articles
-
Pch2 acts through Xrs2 and Tel1/ATM to modulate interhomolog bias and checkpoint function during meiosis.PLoS Genet. 2011 Nov;7(11):e1002351. doi: 10.1371/journal.pgen.1002351. Epub 2011 Nov 3. PLoS Genet. 2011. PMID: 22072981 Free PMC article.
-
The pch2Delta mutation in baker's yeast alters meiotic crossover levels and confers a defect in crossover interference.PLoS Genet. 2009 Jul;5(7):e1000571. doi: 10.1371/journal.pgen.1000571. Epub 2009 Jul 24. PLoS Genet. 2009. PMID: 19629178 Free PMC article.
-
Modulating Crossover Frequency and Interference for Obligate Crossovers in Saccharomyces cerevisiae Meiosis.G3 (Bethesda). 2017 May 5;7(5):1511-1524. doi: 10.1534/g3.117.040071. G3 (Bethesda). 2017. PMID: 28315832 Free PMC article.
-
Getting there: understanding the chromosomal recruitment of the AAA+ ATPase Pch2/TRIP13 during meiosis.Curr Genet. 2021 Aug;67(4):553-565. doi: 10.1007/s00294-021-01166-3. Epub 2021 Mar 12. Curr Genet. 2021. PMID: 33712914 Free PMC article. Review.
-
Balancing the checks: surveillance of chromosomal exchange during meiosis.Biochem Soc Trans. 2006 Aug;34(Pt 4):554-6. doi: 10.1042/BST0340554. Biochem Soc Trans. 2006. PMID: 16856858 Review.
Cited by
-
TRIP13 is a protein-remodeling AAA+ ATPase that catalyzes MAD2 conformation switching.Elife. 2015 Apr 28;4:e07367. doi: 10.7554/eLife.07367. Elife. 2015. PMID: 25918846 Free PMC article.
-
The spindle assembly checkpoint: More than just keeping track of the spindle.Trends Cell Mol Biol. 2015;10:141-150. Trends Cell Mol Biol. 2015. PMID: 27667906 Free PMC article.
-
Meiotic chromosome organization and its role in recombination and cancer.Curr Top Dev Biol. 2023;151:91-126. doi: 10.1016/bs.ctdb.2022.04.008. Epub 2022 Jun 20. Curr Top Dev Biol. 2023. PMID: 36681479 Free PMC article. Review.
-
Pch2 acts through Xrs2 and Tel1/ATM to modulate interhomolog bias and checkpoint function during meiosis.PLoS Genet. 2011 Nov;7(11):e1002351. doi: 10.1371/journal.pgen.1002351. Epub 2011 Nov 3. PLoS Genet. 2011. PMID: 22072981 Free PMC article.
-
Inter-homolog crossing-over and synapsis in Arabidopsis meiosis are dependent on the chromosome axis protein AtASY3.PLoS Genet. 2012 Feb;8(2):e1002507. doi: 10.1371/journal.pgen.1002507. Epub 2012 Feb 2. PLoS Genet. 2012. PMID: 22319460 Free PMC article.
References
-
- Hassold T, Hall H, Hunt P. The origin of human aneuploidy: where we have been, where we are going. Hum Mol Genet. 2007;16:R203–8. - PubMed
-
- Bishop DK, Zickler D. Early decision; Meiotic crossover interference prior to stable strand exchange and synapsis. Cell. 2004;117:9–15. - PubMed
-
- Blitzblau HG, Bell GW, Rodriguez J, Bell SP, Hochwagen A. Mapping of meiotic single-stranded DNA reveals double-stranded-break hotspots near centromeres and telomeres. Curr Biol. 2007;17:2003–12. - PubMed
-
- Buhler C, Borde V, Lichten M. Mapping meiotic single-strand DNA reveals a new landscape of DNA double-strand breaks in Saccharomyces cerevisiae. PLoS Biol. 2007;5:e324. doi: 10.1371/journal.pbio.0050324. - DOI - PMC - PubMed
-
- Keeney S, Giroux CN, Kleckner N. Meiosis-specific DNA double-strand breaks are catalyzed by Spo11, a member of a widely conserved protein family. Cell. 1997;88:375–384. - PubMed
Publication types
MeSH terms
Substances
Grants and funding
LinkOut - more resources
Full Text Sources
Molecular Biology Databases
