

Population pharmacodynamic parameter estimation from sparse sampling: effect of sigmoidicity on parameter estimates
- PMID: 19629711
- PMCID: PMC2758124
- DOI: 10.1208/s12248-009-9131-2
Population pharmacodynamic parameter estimation from sparse sampling: effect of sigmoidicity on parameter estimates
Abstract
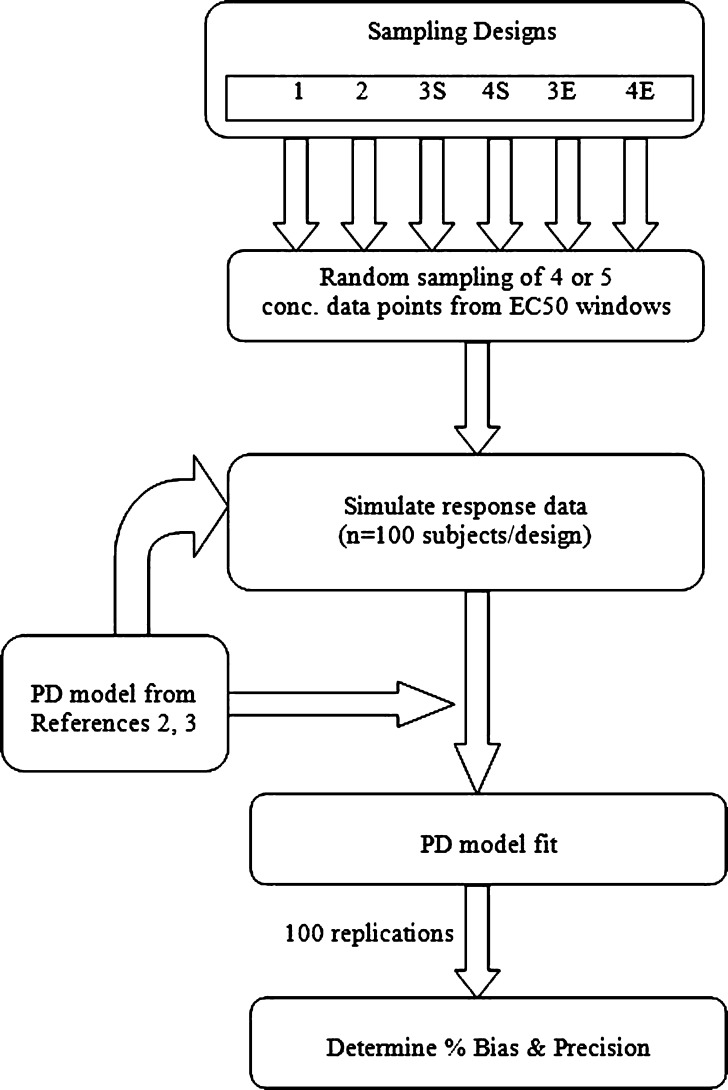
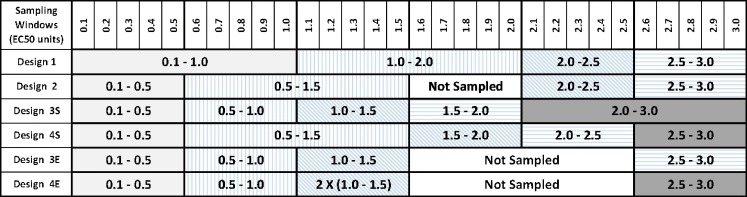
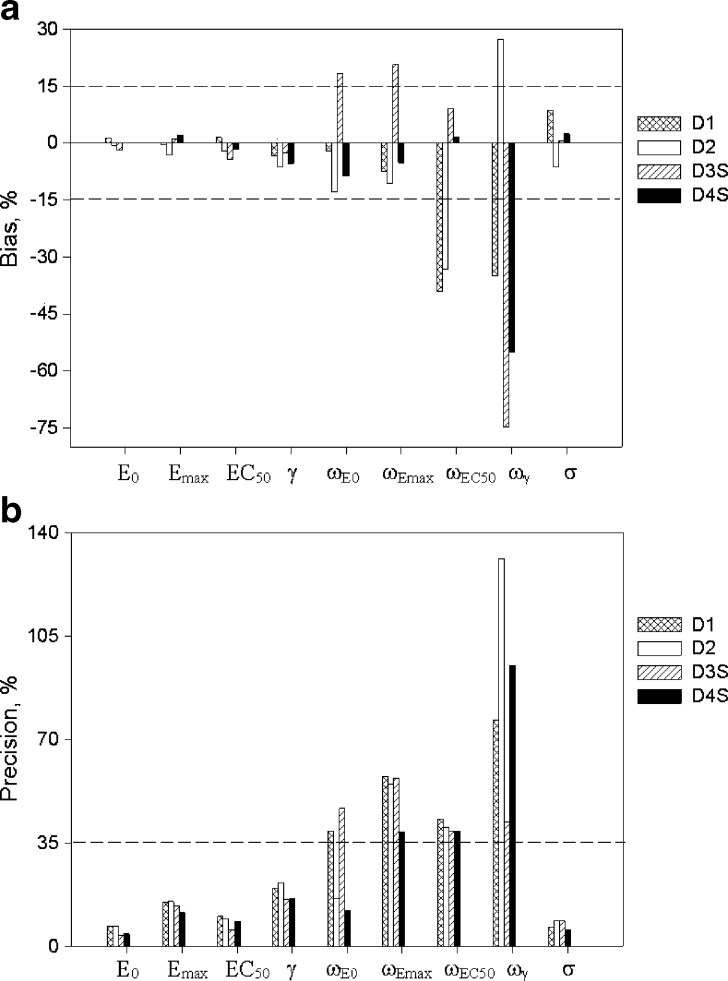
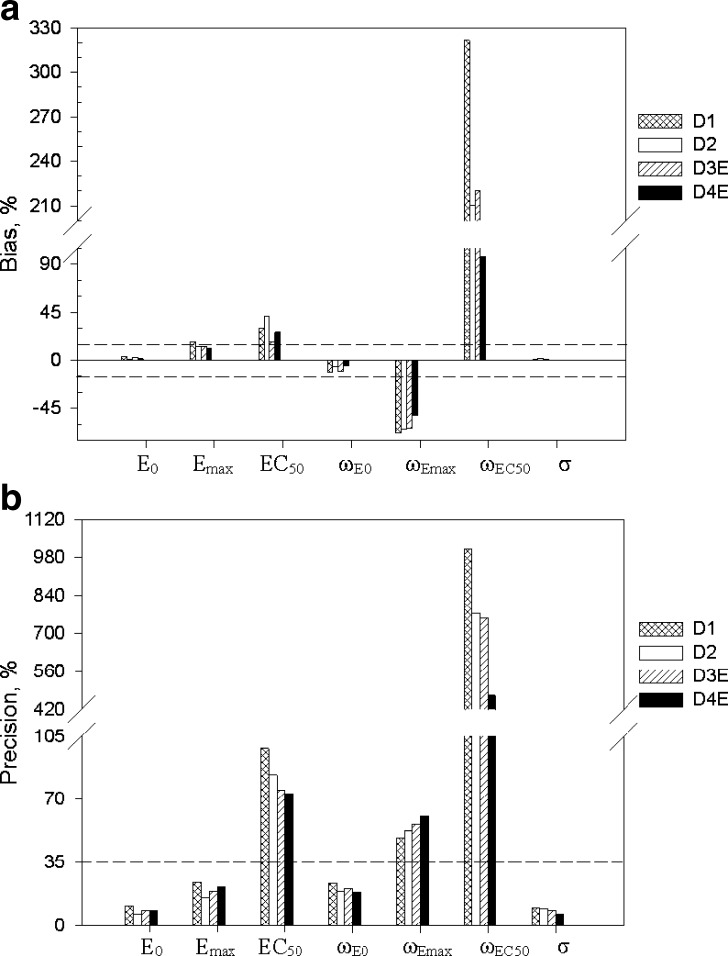
The objective of this stimulation study was to evaluate effect of simoidicity of the concentration-effect (C-E) relationship on the efficiency of population parameter estimation from sparse sampling and is a continuation of previous work that addressed the effect of sample size and number of samples on parameters estimation from sparse sampling for drugs with C-E relationship characterized by high sigmoidicity (gamma > 5). The findings are based on observed C-E relationships for two drugs, octreotide and remifentanil, characterized by simple E (max) and sigmoid E (max) models (gamma = ~2.5), respectively. For each model, C-E profiles (100 replicates of 100 subjects each) were simulated for several sampling designs, with four or five samples/individual randomly obtained from within sampling windows based on EC(50)-normalized plasma drug concentrations, PD parameters based on observed population mean values, and inter-individual and residual variability of 30% and 25%, respectively. The C-E profiles were fitted using non-linear mixed effect modeling with the first-order conditional estimation method; variability parameters were described by an exponential error model. The results showed that, for the sigmoid E (max) model, designs with four or five samples reliably estimated the PD parameters (EC(50), E (max), E (0), and gamma), whereas the five-sample design, with two samples in the 2-3 E (max) region, provided in addition more reliable estimates of inter-individual variability; increasing the information content of the EC(50) region was not critical as long as this region was covered by a single sample in the 0.5-1.5 EC(50) window. For the simple E (max) model, because of the shallower profile, enriching the EC(50) region was more important. The impact of enrichment of appropriate regions for the two models can be explained based on the shape (sigmoidicity) of the concentration-effect relationships, with shallower C-E profiles requiring data enrichment in the EC(50) region and steeper curves less so; in both cases, the E (max) region needs to be adequately delineated, however. The results provide a general framework for population parameter estimation from sparse sampling in clinical trials when the underlying C-E profiles have different degrees of sigmoidicity.
Figures
Similar articles
-
Parameter estimation for sigmoid Emax models in exposure-response relationship.Transl Clin Pharmacol. 2017 Jun;25(2):74-84. doi: 10.12793/tcp.2017.25.2.74. Epub 2017 Jun 15. Transl Clin Pharmacol. 2017. PMID: 32133323 Free PMC article.
-
Pharmacodynamic parameter estimation: population size versus number of samples.AAPS J. 2005 Oct 5;7(2):46. doi: 10.1208/aapsj070246. AAPS J. 2005. PMID: 16353905 Free PMC article. Review.
-
Pharmacodynamic analysis of sparse data from concentration- and effect-controlled clinical trials guided by a pilot study. An investigation by simulations.J Pharm Sci. 1996 Jun;85(6):600-7. doi: 10.1021/js9504705. J Pharm Sci. 1996. PMID: 8773956
-
Is it possible to estimate the parameters of the sigmoid Emax model with truncated data typical of clinical studies?J Pharm Sci. 1996 Feb;85(2):232-9. doi: 10.1021/js950067y. J Pharm Sci. 1996. PMID: 8683454
-
Mycophenolate, clinical pharmacokinetics, formulations, and methods for assessing drug exposure.Transplant Rev (Orlando). 2011 Apr;25(2):47-57. doi: 10.1016/j.trre.2010.06.001. Epub 2010 Dec 28. Transplant Rev (Orlando). 2011. PMID: 21190834
Cited by
-
Impact of Sampling Period on Population Pharmacokinetic Analysis of Antibiotics: Why do You Take Blood Samples Following the Fourth Dose?Pharmaceuticals (Basel). 2020 Sep 16;13(9):249. doi: 10.3390/ph13090249. Pharmaceuticals (Basel). 2020. PMID: 32947890 Free PMC article.
-
Population Pharmacodynamic Modeling Using the Sigmoid Emax Model: Influence of Inter-individual Variability on the Steepness of the Concentration-Effect Relationship. a Simulation Study.AAPS J. 2020 Dec 24;23(1):10. doi: 10.1208/s12248-020-00549-7. AAPS J. 2020. PMID: 33367961 Free PMC article.
-
Parameter estimation for sigmoid Emax models in exposure-response relationship.Transl Clin Pharmacol. 2017 Jun;25(2):74-84. doi: 10.12793/tcp.2017.25.2.74. Epub 2017 Jun 15. Transl Clin Pharmacol. 2017. PMID: 32133323 Free PMC article.
-
Optimised protocol design for the screening of analgesic compounds in neuropathic pain.J Pharmacokinet Pharmacodyn. 2012 Dec;39(6):661-71. doi: 10.1007/s10928-012-9277-x. Epub 2012 Nov 30. J Pharmacokinet Pharmacodyn. 2012. PMID: 23197246
-
Feasibility of Exposure-Response Analyses for Clinical Dose-Ranging Studies of Drug Combinations.AAPS J. 2018 Apr 23;20(3):64. doi: 10.1208/s12248-018-0226-5. AAPS J. 2018. PMID: 29687351
References
-
- White DB, Walawander CA, Tung Y, Grasela TH. An evaluation of point and interval estimates in population pharmacokinetics using NONMEM analysis. J Pharmacokinet Biopharm. 1991;19:87–112. - PubMed
-
- Beal SL, Sheiner LB. NONMEM user’s guide parts I–VIII. San Francisco: University of California; 1998.
MeSH terms
Substances
LinkOut - more resources
Full Text Sources
