

Myocardial T2 quantitation in patients with iron overload at 3 Tesla
- PMID: 19629983
- PMCID: PMC2946793
- DOI: 10.1002/jmri.21851
Myocardial T2 quantitation in patients with iron overload at 3 Tesla
Erratum in
- J Magn Reson Imaging. 2009 Nov;30(5):1230
Abstract
Purpose: To investigate the feasibility of measuring myocardial T2 at 3 Tesla for assessment of tissue iron in thalassemia major and other iron overloaded patients.
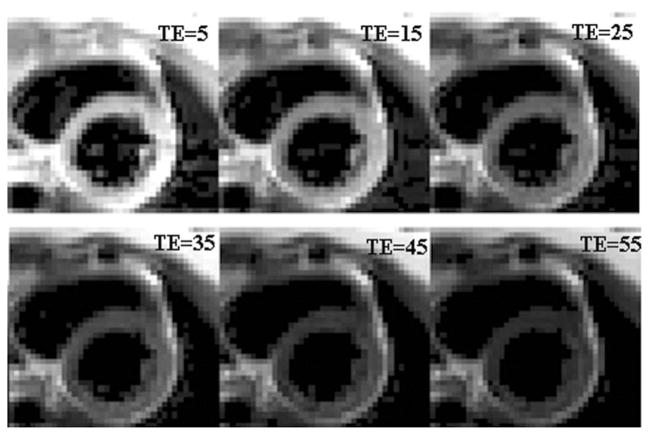
Materials and methods: A single-breathhold electrocardiogram-triggered black-blood multi-echo spin-echo (MESE) sequence with a turbo factor of 2 was implemented at 3 Tesla (T). Myocardial and liver T2 values were measured with three repeated breathholds in 8 normal subjects and 24 patients. Their values, together with the T2 values measured using a breathhold multi-echo gradient-echo sequence, were compared with those at 1.5T in the same patients.
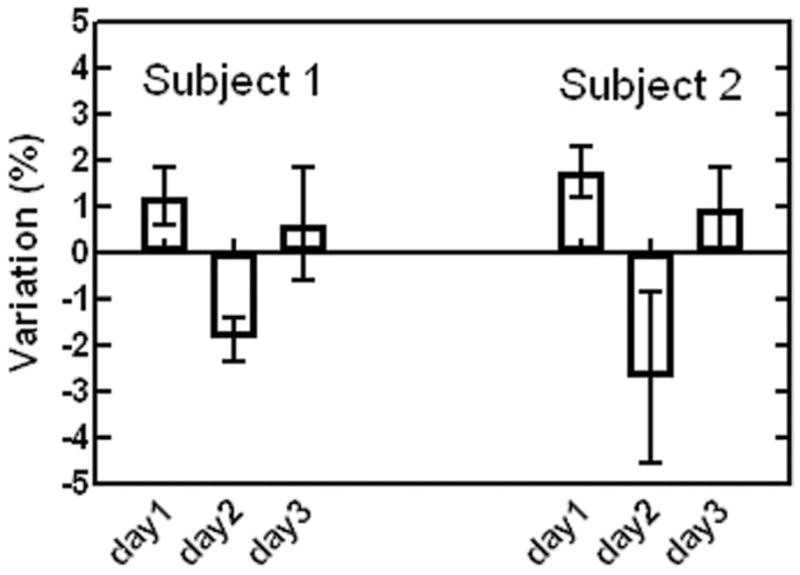
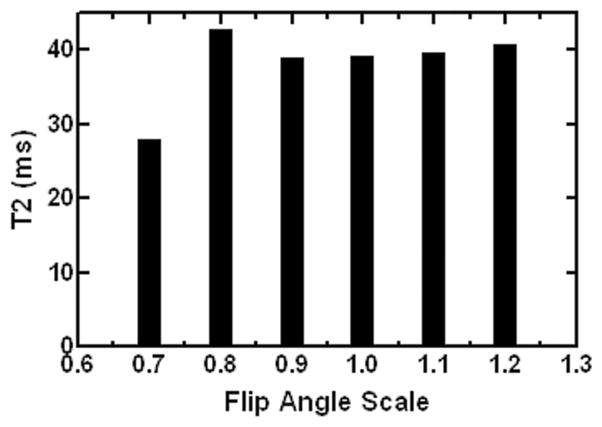
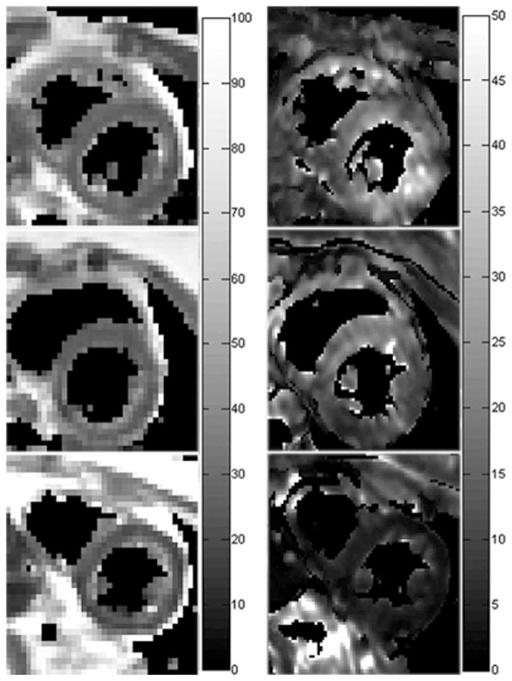
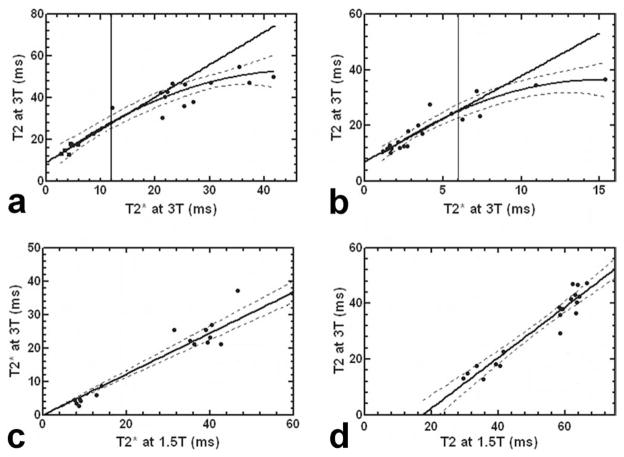
Results: At 3T, myocardial T2 was found to be 39.6 +/- 7.4 ms in normal subjects. In patients, it ranged from 12.9 to 50.1 ms. "T2 and T2(*) [corrected] were observed to correlate in heart (rho = 0.93, P [corrected] < 0.0001) and liver (rho = 0.95, P < 0.0001). Myocardial T2 and T2 at 3T were also highly correlated with the 1.5T measurements. Preliminary results indicated that myocardial T2 quantitation was relatively insensitive to B1 variation, and reproducible with 3.2% intra-exam and 3.8% inter-exam variations.
Conclusion: Myocardial T2 quantitation is feasible at 3T. Given the substantially decreased T2 and increased B0 inhomogeneity, the rapid myocardial T2 measurement protocol demonstrated here may present a robust alternative to study cardiac iron overload at 3T.
(c) 2009 Wiley-Liss, Inc.
Figures
References
-
- Mentzer WC, Kan YW. Prospects for research in hematologic disorders: sickle cell disease and thalassemia. JAMA. 2001;285:640–642. - PubMed
-
- Tuzmen S, Schechter AN. Genetic diseases of hemoglobin: diagnostic methods for elucidating beta-thalassemia mutations. Blood Rev. 2001;15:19–29. - PubMed
-
- Borgna-Pignatti C, Rugolotto S, De Stefano P, et al. Survival and complications in patients with thalassemia major treated with transfusion and deferoxamine. Haematologica. 2004;89:1187–1193. - PubMed
-
- Brittenham GM, Griffith PM, Nienhuis AW, et al. Efficacy of deferoxamine in preventing complications of iron overload in patients with thalassemia major. N Engl J Med. 1994;331:567–573. - PubMed
-
- Brittenham GM, Badman DG. Noninvasive measurement of iron: report of an NIDDK workshop. Blood. 2003;101:15–19. - PubMed
Publication types
MeSH terms
Grants and funding
LinkOut - more resources
Full Text Sources
Other Literature Sources
Medical
