

Quantitative MRI measurement of lung density must account for the change in T(2) (*) with lung inflation
- PMID: 19630079
- PMCID: PMC3354915
- DOI: 10.1002/jmri.21866
Quantitative MRI measurement of lung density must account for the change in T(2) (*) with lung inflation
Abstract
Purpose: To evaluate lung water density at three different levels of lung inflation in normal lungs using a fast gradient echo sequence developed for rapid imaging.
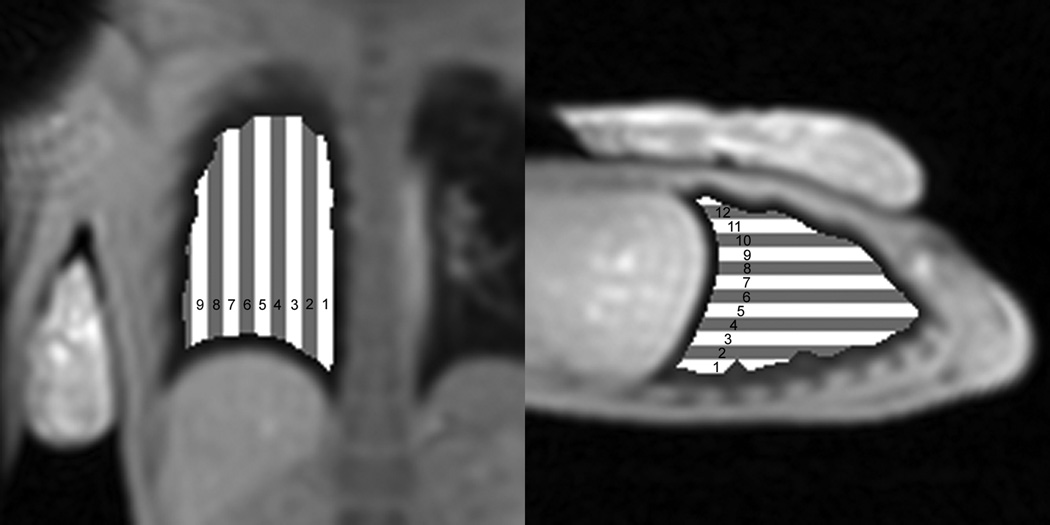
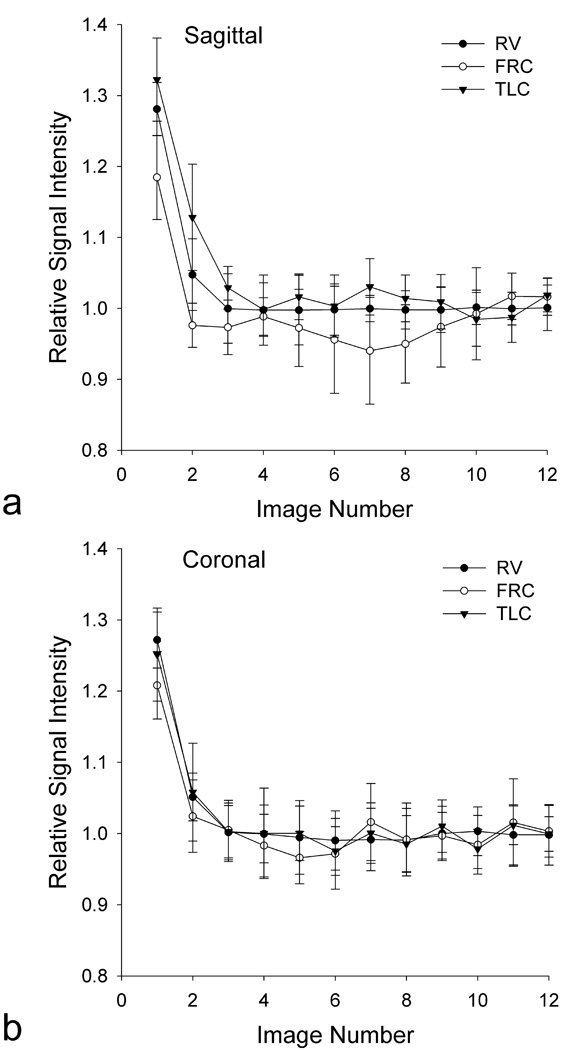
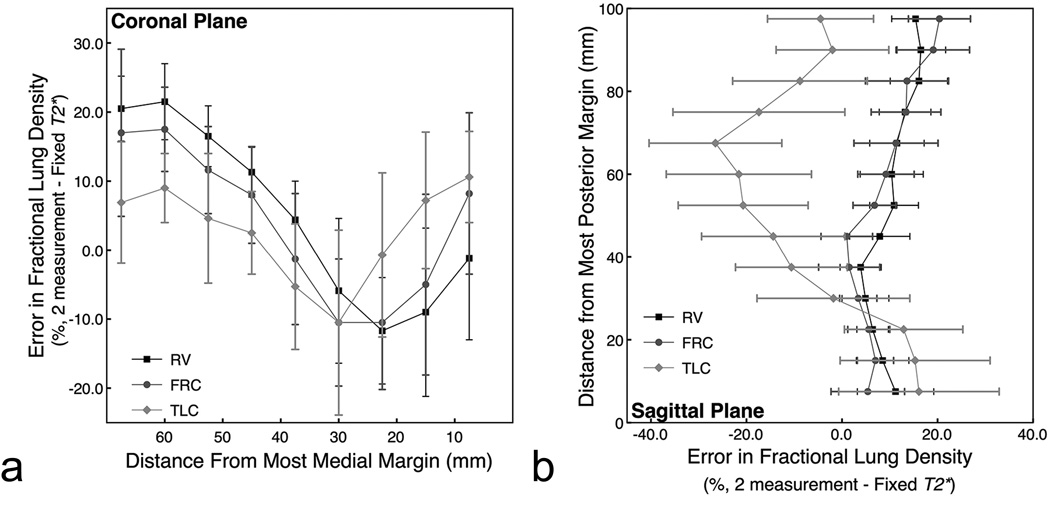
Materials and methods: Ten healthy volunteers were imaged with a fast gradient echo sequence that collects 12 images alternating between two closely spaced echoes in a single 9-s breathhold. Data were fit to a single exponential to determine lung water density and T(2) (*). Data were evaluated in a single imaging slice at total lung capacity (TLC), functional residual capacity (FRC), and residual volume (RV). Analysis of variance for repeated measures was used to statistically evaluate changes in T(2) (*) and lung water density across lung volumes, imaging plane, and spatial locations in the lung.
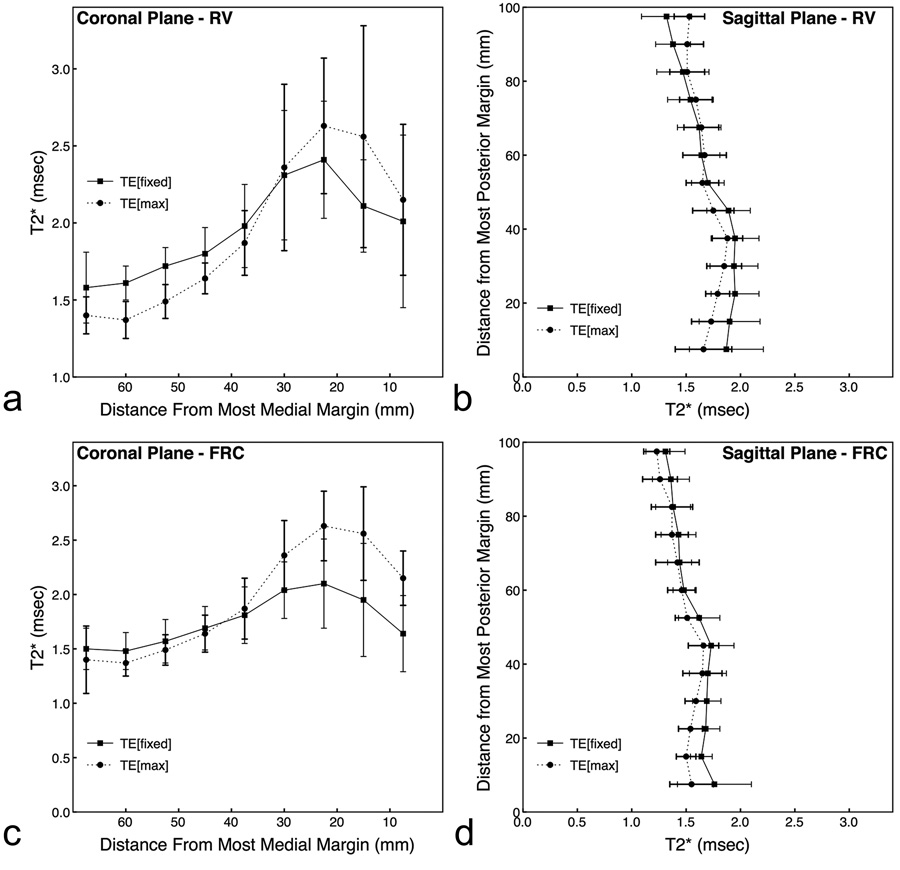
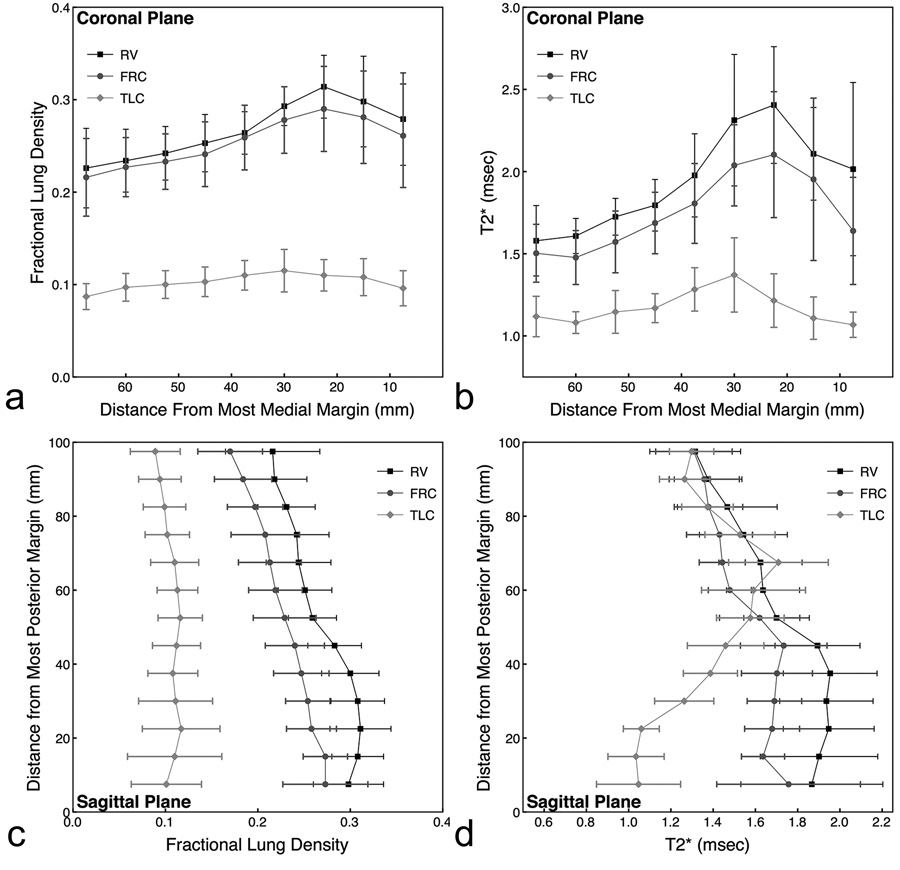
Results: In normal subjects (n = 10), T(2) (*) (and [lung density/water density]) was 1.2 +/- 0.1 msec (0.10 +/- 0.02), 1.8 +/- 0.2 ms (0.25 +/- 0.04), and 2.0 +/- 0.2 msec (0.27 +/- 0.03) at TLC, FRC, and RV, respectively. Results also show that there is a considerable intersubject variability in the values of T(2) (*).
Conclusion: Data show that T(2) (*) in the lung is very short, and varies considerably with lung volume. Thus, if quantitative assessment of lung density within a breathhold is to be measured accurately, then it is necessary to also determine T(2) (*).
Figures
References
-
- Brudin L, Rhodes C, Valind S, Wollmer P, Hughes J. Regional lung density and blood volume in nonsmoking and smoking subjects measured by PET. J Appl Physiol. 1987;63:1324–1334. - PubMed
-
- Schuster D, Marklin G. Effect of changes in inflation and blood volume on regional lung density--a PET study: 2. J Comput Assist Tomogr. 1986;10(5):730–735. - PubMed
-
- Schuster D, Marklin G, Mintun M, Ter-Pogossian M. PET measurement of regional lung density: 1. J Comput Assist Tomogr. 1986;10(5):723–729. - PubMed
-
- Sandiford P, Province M, Schuster D. Distribution of regional density and vascular permeability in the adult respiratory distress syndrome. Am J Respir Crit Care Med. 1995;151(3 Pt 1):737–742. - PubMed
-
- Estilaei M, MacKay A, Whittall K, Mayo J. In vitro measurements of water content and T2 relaxation times in lung using a clinical MRI scanner. J Magn Reson Imaging. 1999;9(5):699–703. - PubMed
Publication types
MeSH terms
Substances
Grants and funding
LinkOut - more resources
Full Text Sources
Other Literature Sources
Medical
