

Modulated repetition time look-locker (MORTLL): a method for rapid high resolution three-dimensional T1 mapping
- PMID: 19630081
- PMCID: PMC2753510
- DOI: 10.1002/jmri.21842
Modulated repetition time look-locker (MORTLL): a method for rapid high resolution three-dimensional T1 mapping
Abstract
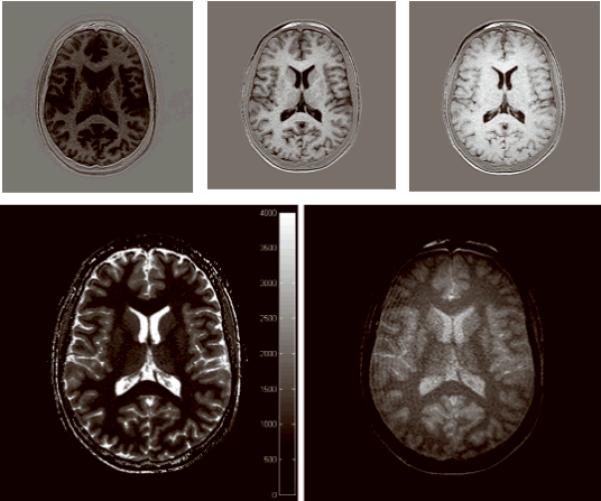
Purpose: To demonstrate a modification of the Look-Locker (LL) technique that enables rapid high resolution T1 mapping over the physiologic range of intracranial T1 values, ranging from white matter to cerebrospinal fluid (CSF). This is achieved by use of a three-dimensional (3D) balanced steady-state free precession (b-SSFP) acquisition (for high signal-to-noise and resolution) along with variable repetition time to allow effective full recovery of longitudinal magnetization.
Materials and methods: Two modifications to the Look-Locker technique were made to realize high resolution imaging in a clinically reasonable scan time. The 3D b-SSFP acquisition after an initial inversion pulse was followed by a variable repetition time. This technique makes it possible to image a volume of thin contiguous slices with high resolution and accuracy using a simple fitting procedure and is particularly useful for imaging long T1 species such as CSF. The total scan time is directly proportional to the number of slices to be acquired. The scan time was reduced by almost half when the repetition time was modified using a predesigned smooth function. Phantoms and volunteers were imaged at different resolutions on a 3 Tesla scanner. Results were compared with other accepted techniques.
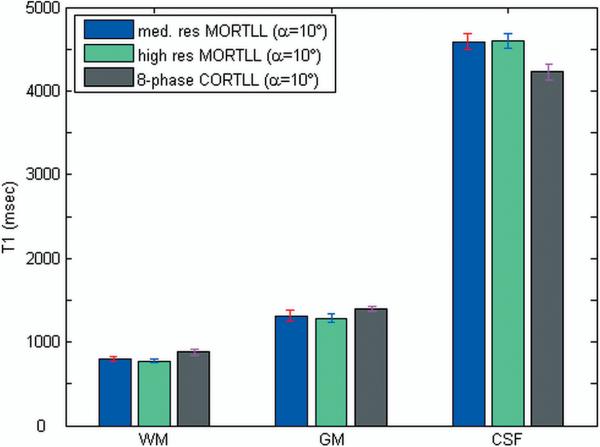
Results: T1 values in the brain corresponded well with full repetition time imaging as well as inversion recovery spin echo imaging. T1 values for white matter, gray matter, and CSF were measured to be 755 +/- 10 ms, 1202 +/- 9 ms, and 4482 +/- 71 ms, respectively. Scan times were reduced by approximately half over full repetition time measurements.
Conclusion: High resolution T1 maps can be obtained rapidly and with a relatively simple postprocessing method. The technique is particularly well suited for long T1 species. For example, changes in the composition of proteins in CSF are linked to various pathologies. The T1 values showed excellent agreement with values obtained from inversion recovery spin-echo imaging.
Figures


References
-
- Deoni SC. High-resolution T1 mapping of the brain at 3T with driven equilibrium single pulse observation of T1 with high-speed incorporation of RF field inhomogeneities (DESPOT1-HIFI) J Magn Reson Imaging. 2007;26:1106–1111. - PubMed
-
- Treier R, Steingoetter A, Fried M, Schwizer W, Boesiger P. Optimized and combined T1 and B1 mapping technique for fast and accurate T1 quantification in contrast-enhanced abdominal MRI. Magn Reson Med. 2007;57:568–576. - PubMed
-
- Steen RG, Gronemeyer SA, Kingsley PB, Reddick WE, Langston S, Taylor JS. Precise and accurate measurement of proton T1 in human brain in vivo: Validation and preliminary clinical application. J Magn Reson. 1994;4:681–691. - PubMed
-
- Conturo RR, Price RR, Beth AH, et al. Improved determination of spin density, T1 and T2 from a three-parameter fit to multiple-delay-multiple-echo (MDME) NMR images. Phys Med Biol. 1986;31:1361–1380. - PubMed
-
- Haase A, Frahm J. NMR imaging of spin-lattice relaxation using stimulated echoes. J Magn Reson. 1985;65:481–490.
Publication types
MeSH terms
Grants and funding
LinkOut - more resources
Full Text Sources
Other Literature Sources
