

Analysis of fine-scale mammalian evolutionary breakpoints provides new insight into their relation to genome organisation
- PMID: 19630943
- PMCID: PMC2722678
- DOI: 10.1186/1471-2164-10-335
Analysis of fine-scale mammalian evolutionary breakpoints provides new insight into their relation to genome organisation
Abstract
Background: The Intergenic Breakage Model, which is the current model of structural genome evolution, considers that evolutionary rearrangement breakages happen with a uniform propensity along the genome but are selected against in genes, their regulatory regions and in-between. However, a growing body of evidence shows that there exists regions along mammalian genomes that present a high susceptibility to breakage. We reconsidered this question taking advantage of a recently published methodology for the precise detection of rearrangement breakpoints based on pairwise genome comparisons.
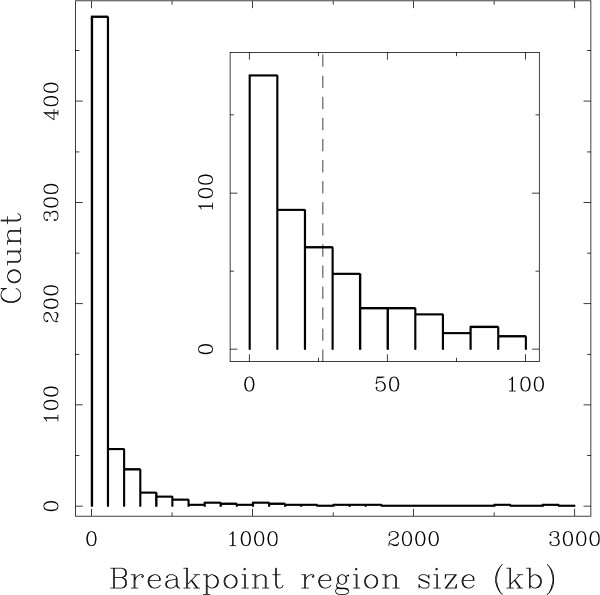
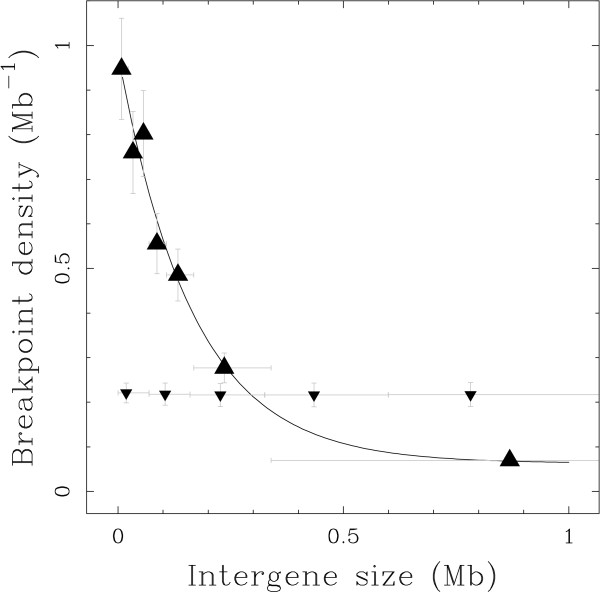
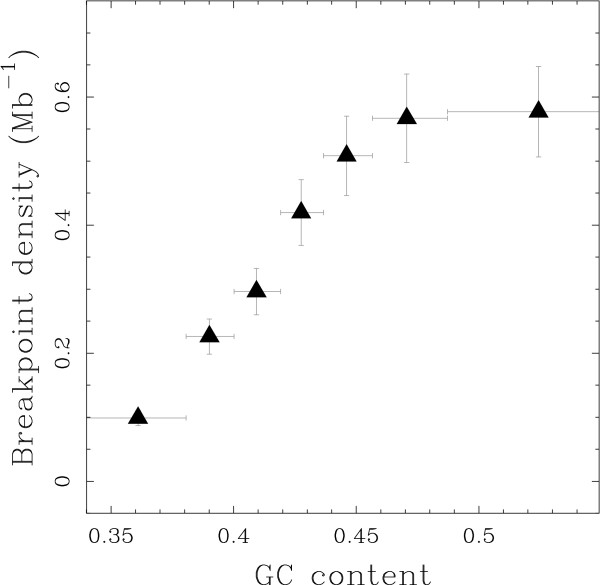
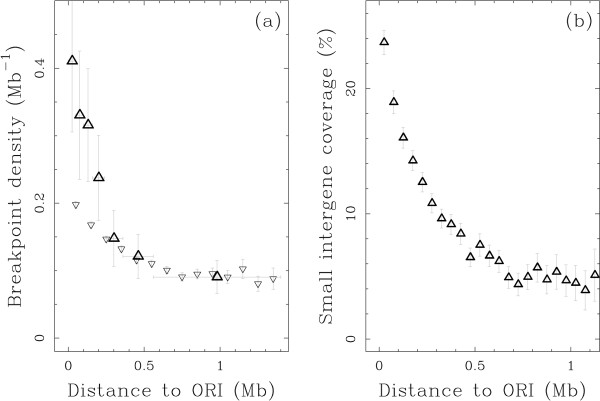
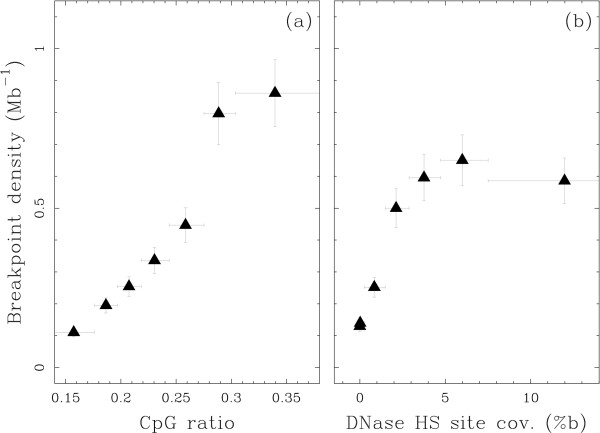
Results: We applied this methodology between the genome of human and those of five sequenced eutherian mammals which allowed us to delineate evolutionary breakpoint regions along the human genome with a finer resolution (median size 26.6 kb) than obtained before. We investigated the distribution of these breakpoints with respect to genome organisation into domains of different activity. In agreement with the Intergenic Breakage Model, we observed that breakpoints are under-represented in genes. Surprisingly however, the density of breakpoints in small intergenes (1 per Mb) appears significantly higher than in gene deserts (0.1 per Mb).More generally, we found a heterogeneous distribution of breakpoints that follows the organisation of the genome into isochores (breakpoints are more frequent in GC-rich regions). We then discuss the hypothesis that regions with an enhanced susceptibility to breakage correspond to regions of high transcriptional activity and replication initiation.
Conclusion: We propose a model to describe the heterogeneous distribution of evolutionary breakpoints along human chromosomes that combines natural selection and a mutational bias linked to local open chromatin state.
Figures
Similar articles
-
Precise detection of rearrangement breakpoints in mammalian chromosomes.BMC Bioinformatics. 2008 Jun 18;9:286. doi: 10.1186/1471-2105-9-286. BMC Bioinformatics. 2008. PMID: 18564416 Free PMC article.
-
Gene synteny comparisons between different vertebrates provide new insights into breakage and fusion events during mammalian karyotype evolution.BMC Evol Biol. 2009 Apr 24;9:84. doi: 10.1186/1471-2148-9-84. BMC Evol Biol. 2009. PMID: 19393055 Free PMC article.
-
Dynamics of mammalian chromosome evolution inferred from multispecies comparative maps.Science. 2005 Jul 22;309(5734):613-7. doi: 10.1126/science.1111387. Science. 2005. PMID: 16040707
-
Molecular mechanisms of chromosomal rearrangement during primate evolution.Chromosome Res. 2008;16(1):41-56. doi: 10.1007/s10577-007-1207-1. Chromosome Res. 2008. PMID: 18293104 Review.
-
The vertebrate genome: isochores and evolution.Mol Biol Evol. 1993 Jan;10(1):186-204. doi: 10.1093/oxfordjournals.molbev.a039994. Mol Biol Evol. 1993. PMID: 8450755 Review.
Cited by
-
Modeling the evolution space of breakage fusion bridge cycles with a stochastic folding process.J Math Biol. 2016 Jan;72(1-2):47-86. doi: 10.1007/s00285-015-0875-2. Epub 2015 Apr 2. J Math Biol. 2016. PMID: 25833184 Free PMC article.
-
Ancestral grass karyotype reconstruction unravels new mechanisms of genome shuffling as a source of plant evolution.Genome Res. 2010 Nov;20(11):1545-57. doi: 10.1101/gr.109744.110. Epub 2010 Sep 28. Genome Res. 2010. PMID: 20876790 Free PMC article.
-
Long-range promoter-enhancer contacts are conserved during evolution and contribute to gene expression robustness.Genome Res. 2022 Feb;32(2):280-296. doi: 10.1101/gr.275901.121. Epub 2021 Dec 20. Genome Res. 2022. PMID: 34930799 Free PMC article.
-
Linking the DNA strand asymmetry to the spatio-temporal replication program: II. Accounting for neighbor-dependent substitution rates.Eur Phys J E Soft Matter. 2012 Nov;35(11):123. doi: 10.1140/epje/i2012-12123-9. Epub 2012 Nov 27. Eur Phys J E Soft Matter. 2012. PMID: 23179013
-
Chromosomal Speciation in the Genomics Era: Disentangling Phylogenetic Evolution of Rock-wallabies.Front Genet. 2017 Feb 10;8:10. doi: 10.3389/fgene.2017.00010. eCollection 2017. Front Genet. 2017. PMID: 28265284 Free PMC article.
References
Publication types
MeSH terms
Substances
LinkOut - more resources
Full Text Sources
Miscellaneous
