

Magnetic resonance imaging for secondary assessment of breast density in a high-risk cohort
- PMID: 19631485
- PMCID: PMC4087111
- DOI: 10.1016/j.mri.2009.05.040
Magnetic resonance imaging for secondary assessment of breast density in a high-risk cohort
Abstract
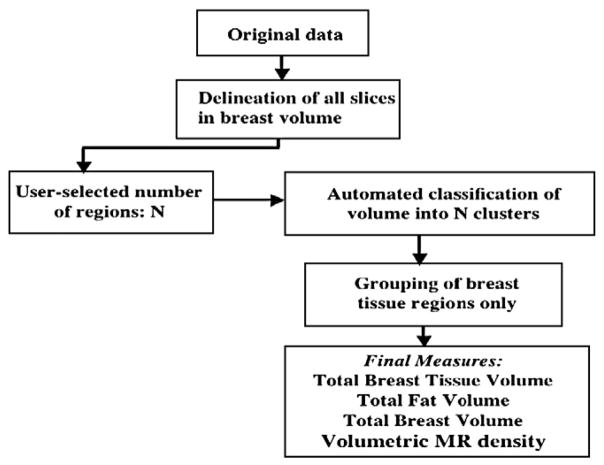
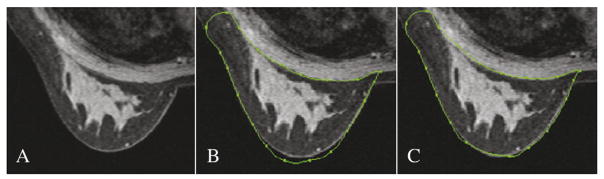
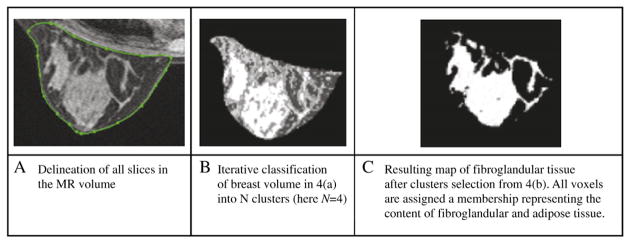
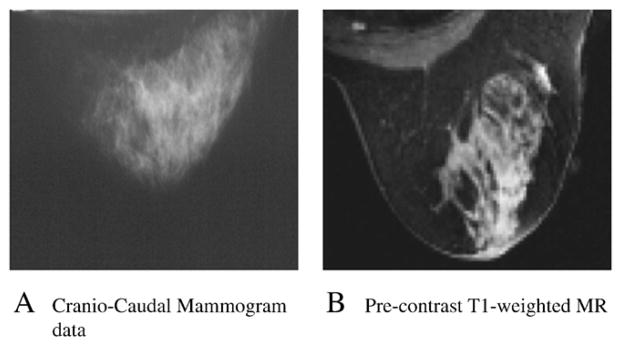
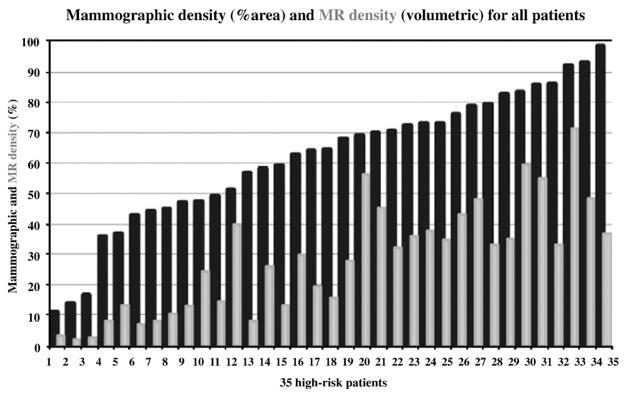
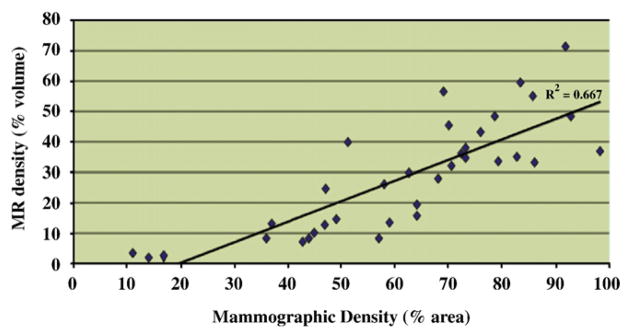
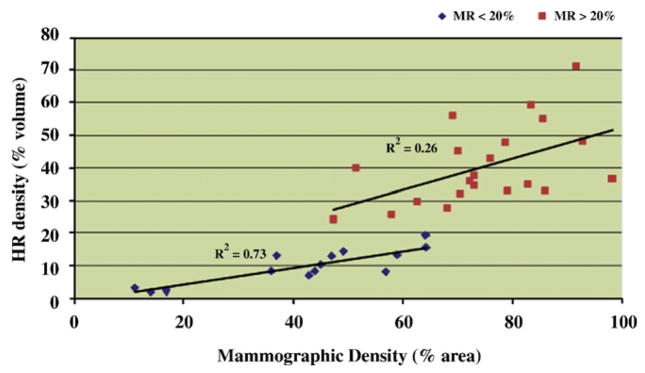
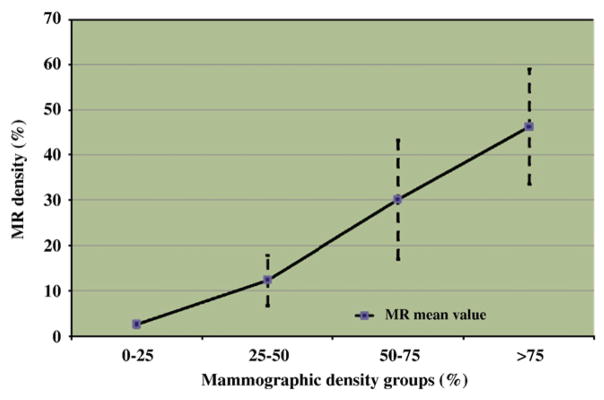
A quantitative measure of three-dimensional breast density derived from noncontrast magnetic resonance imaging (MRI) was investigated in 35 women at high-risk for breast cancer. A semiautomatic segmentation tool was used to quantify the total volume of the breast and to separate volumes of fibroglandular and adipose tissue in noncontrast MRI data. The MRI density measure was defined as the ratio of breast fibroglandular volume over total volume of the breast. The overall correlation between MRI and mammographic density measures was R(2)=.67. However the MRI/mammography density correlation was higher in patients with lower breast density (R(2)=.73) than in patients with higher breast density (R(2)=.26). Women with mammographic density higher than 25% exhibited very different magnetic resonance density measures spread over a broad range of values. These results suggest that MRI may provide a volumetric measure more representative of breast composition than mammography, particularly in groups of women with dense breasts. Magnetic resonance imaging density could potentially be quantified and used for a better assessment of breast cancer risk in these populations.
Figures
Similar articles
-
Introduction of an automated user-independent quantitative volumetric magnetic resonance imaging breast density measurement system using the Dixon sequence: comparison with mammographic breast density assessment.Invest Radiol. 2015 Feb;50(2):73-80. doi: 10.1097/RLI.0000000000000102. Invest Radiol. 2015. PMID: 25333307 Clinical Trial.
-
Volumetric breast density estimation from full-field digital mammograms.IEEE Trans Med Imaging. 2006 Mar;25(3):273-82. doi: 10.1109/TMI.2005.862741. IEEE Trans Med Imaging. 2006. PMID: 16524084 Clinical Trial.
-
Breast Density Analysis with Automated Whole-Breast Ultrasound: Comparison with 3-D Magnetic Resonance Imaging.Ultrasound Med Biol. 2016 May;42(5):1211-20. doi: 10.1016/j.ultrasmedbio.2015.12.015. Epub 2016 Jan 28. Ultrasound Med Biol. 2016. PMID: 26831342
-
Computed-aided diagnosis (CAD) in the detection of breast cancer.Eur J Radiol. 2013 Mar;82(3):417-23. doi: 10.1016/j.ejrad.2012.03.005. Epub 2012 Aug 30. Eur J Radiol. 2013. PMID: 22939365 Review.
-
Principles and methods for automatic and semi-automatic tissue segmentation in MRI data.MAGMA. 2016 Apr;29(2):95-110. doi: 10.1007/s10334-015-0520-5. Epub 2016 Jan 11. MAGMA. 2016. PMID: 26755062 Review.
Cited by
-
Atlas-based probabilistic fibroglandular tissue segmentation in breast MRI.Med Image Comput Comput Assist Interv. 2012;15(Pt 2):437-45. doi: 10.1007/978-3-642-33418-4_54. Med Image Comput Comput Assist Interv. 2012. PMID: 23286078 Free PMC article.
-
Comparison of breast tissue measurements using magnetic resonance imaging, digital mammography and a mathematical algorithm.Phys Med Biol. 2012 Nov 7;57(21):6903-27. doi: 10.1088/0031-9155/57/21/6903. Epub 2012 Oct 9. Phys Med Biol. 2012. PMID: 23044556 Free PMC article.
-
Comparison of breast density measured on MR images acquired using fat-suppressed versus nonfat-suppressed sequences.Med Phys. 2011 Nov;38(11):5961-8. doi: 10.1118/1.3646756. Med Phys. 2011. PMID: 22047360 Free PMC article.
-
MRI-based Deep Learning Models for Preoperative Breast Volume and Density Assessment Assisting Breast Reconstruction.Aesthetic Plast Surg. 2024 Dec;48(23):4994-5006. doi: 10.1007/s00266-024-04074-2. Epub 2024 May 28. Aesthetic Plast Surg. 2024. PMID: 38806828
-
Quantitative Measurements of Breast Density Using Magnetic Resonance Imaging: A Systematic Review and Meta-Analysis.J Clin Med. 2019 May 24;8(5):745. doi: 10.3390/jcm8050745. J Clin Med. 2019. PMID: 31137728 Free PMC article. Review.
References
-
- Boyd NF, Lockwood GA, Byng JW, et al. Mammographic densities and breast cancer risk. Cancer Epidemiol Biomarkers Prev. 1998;7:1133–44. - PubMed
-
- Boyd NF, Greenberg C, Lockwood GA, et al. Effects of a 2 years of a low fat high-carbohydrate diet on radiologic features of the breast. J Natl Cancer Inst. 1997;89(7):488–96. - PubMed
-
- Byrne C, Schairer C, Wolfe J, et al. Mammographic features and breast cancer risk: effects with time, age and menopause status. J Natl Cancer Inst. 1995;87(21):1622–9. - PubMed
-
- Hersh MR. Imaging the dense breast. Appl Radiol. 2004;33(1):22–6.
-
- Tilanus-Linthorst MM, Obdeijn IM, Bartels KC. First experiences in screening women at high risk for breast cancer with MR imaging. Breast Cancer Res Treat. 2000;63(1):53–60. - PubMed
Publication types
MeSH terms
Grants and funding
LinkOut - more resources
Full Text Sources
Other Literature Sources
Medical
