

Altered NK cell development and enhanced NK cell-mediated resistance to mouse cytomegalovirus in NKG2D-deficient mice
- PMID: 19631564
- PMCID: PMC2782462
- DOI: 10.1016/j.immuni.2009.06.017
Altered NK cell development and enhanced NK cell-mediated resistance to mouse cytomegalovirus in NKG2D-deficient mice
Abstract
NKG2D is a potent activating receptor on natural killer (NK) cells and acts as a molecular sensor for stressed cells expressing NKG2D ligands such as infected or tumor-transformed cells. Although NKG2D is expressed on NK cell precursors, its role in NK cell development is not known. We have generated NKG2D-deficient mice by targeting the Klrk1 locus. Here we provide evidence for an important regulatory role of NKG2D in the development of NK cells. The absence of NKG2D caused faster division of NK cells, perturbation in size of some NK cell subpopulations, and their augmented sensitivity to apoptosis. As expected, Klrk1(-/-) NK cells are less responsive to tumor targets expressing NKG2D ligands. Klrk1(-/-) mice, however, showed an enhanced NK cell-mediated resistance to mouse cytomegalovirus infection as a consequence of NK cell dysregulation. Altogether, these findings provide evidence for regulatory function of NKG2D in NK cell physiology.
Figures


 ) or NKG2D−/− (●) mice are shown. (B) Percentages and absolute numbers of NK and B cells isolated from the spleen and inguinal lymph nodes of C57BL/6 (○) and NKG2D−/− (●) mice are shown. Each symbol represents an individual mouse. Horizontal lines represent mean values.
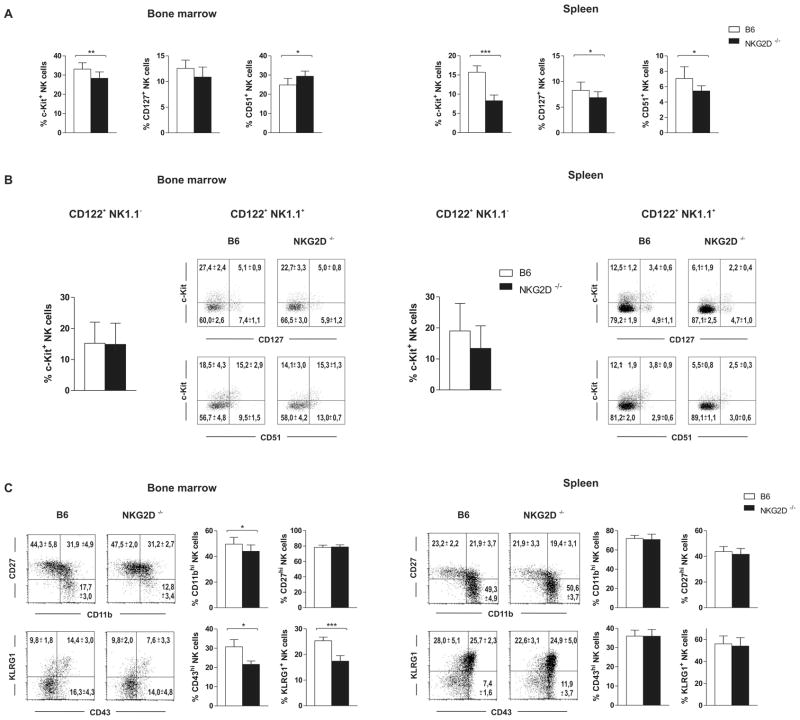


 ), and C57BL/6 (○) mice were treated either with PBS, αNK1.1 (PK136) or αNKG2D (C7) prior to i.v. infection with 5 × 10⁵ PFU Δm157 MCMV. Virus titers determined in the spleen and liver 4 days after the infection are shown. Each symbol represents an individual mouse. Median values are indicated as horizontal lines. Representative of six independent experiments is shown. (B) Survival of NKG2D−/− (●), NKG2D+/− (), and C57BL/6 (○) mice upon the infection with either 2 or 3 × 10⁵ PFU of SGV is shown. Control mice treated with mock infected salivary gland homogenate (SGH, dashed line) as well as infected and NK cell depleted mice are shown (dotted line). Numbers of mice per group are indicated. Data is representative of three independent experiments. (C) Kinetics of NK cells in the spleen of NKG2D−/− and C57BL/6 mice is shown. Results are expressed as mean ± SD of at least five mice per group. (D) Percentages of Ly49H+ or Ly49A+ NK cell populations in the spleen of the Δm157 MCMV infected mice are depicted for each indicated time point. Representative of two independent experiments is shown (C, D).
References
-
- Arase H, Mocarski ES, Campbell AE, Hill AB, Lanier LL. Direct recognition of cytomegalovirus by activating and inhibitory NK cell receptors. Science (New York, NY) 2002;296:1323–1326. - PubMed
-
- Bacon L, Eagle RA, Meyer M, Easom N, Young NT, Trowsdale J. Two human ULBP/RAET1 molecules with transmembrane regions are ligands for NKG2D. J Immunol. 2004;173:1078–1084. - PubMed
-
- Bakker AB, Hoek RM, Cerwenka A, Blom B, Lucian L, McNeil T, Murray R, Phillips LH, Sedgwick JD, Lanier LL. DAP12-deficient mice fail to develop autoimmunity due to impaired antigen priming. Immunity. 2000;13:345–353. - PubMed
-
- Bartkova J, Horejsi Z, Koed K, Kramer A, Tort F, Zieger K, Guldberg P, Sehested M, Nesland JM, Lukas C, et al. DNA damage response as a candidate anti-cancer barrier in early human tumorigenesis. Nature. 2005;434:864–870. - PubMed
-
- Bauer S, Groh V, Wu J, Steinle A, Phillips JH, Lanier LL, Spies T. Activation of NK cells and T cells by NKG2D, a receptor for stress-inducible MICA. Science (New York, NY) 1999;285:727–729. - PubMed
Publication types
MeSH terms
Substances
Grants and funding
LinkOut - more resources
Full Text Sources
Other Literature Sources
Molecular Biology Databases
Research Materials
