Comparative Study
. 2009 Oct;13(5):679-700.
doi: 10.1016/j.media.2009.06.002. Epub 2009 Jun 24.

Comparing registration methods for mapping brain change using tensor-based morphometry

Affiliations
Comparative Study

Comparing registration methods for mapping brain change using tensor-based morphometry

Igor Yanovsky et al. Med Image Anal. 2009 Oct.

Abstract

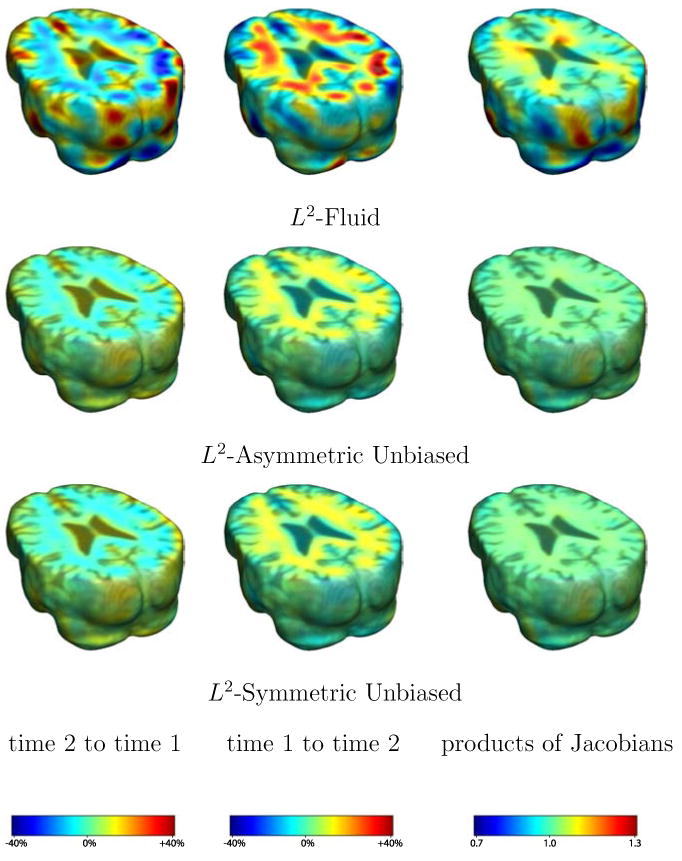
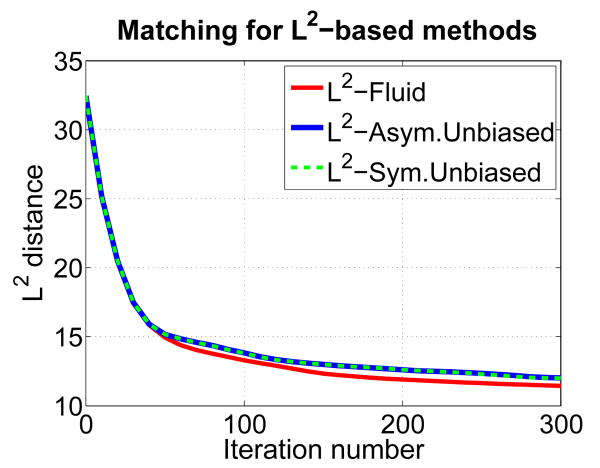
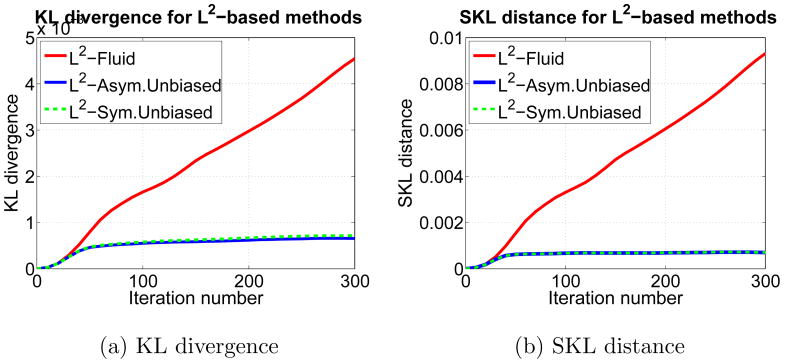
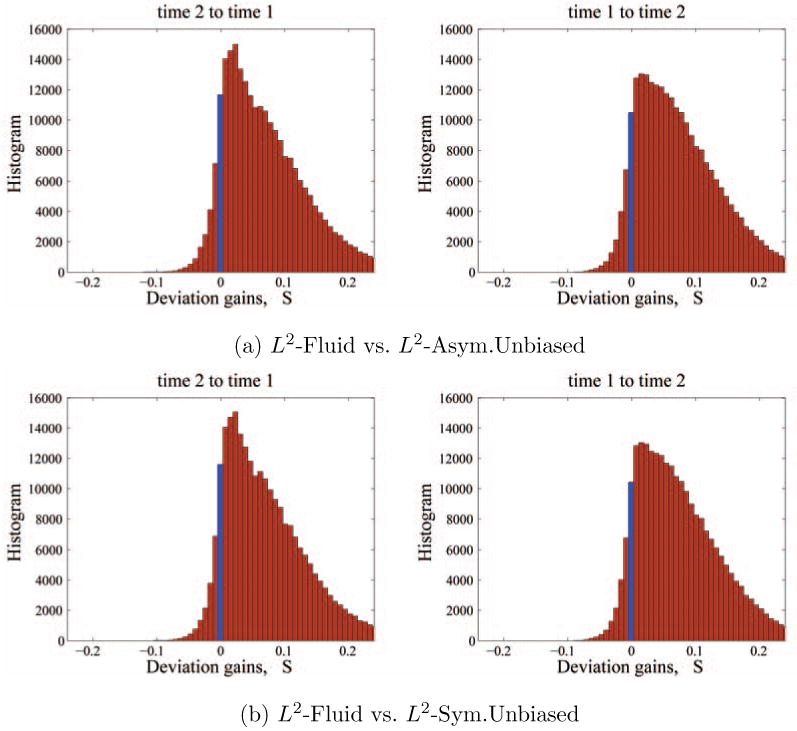
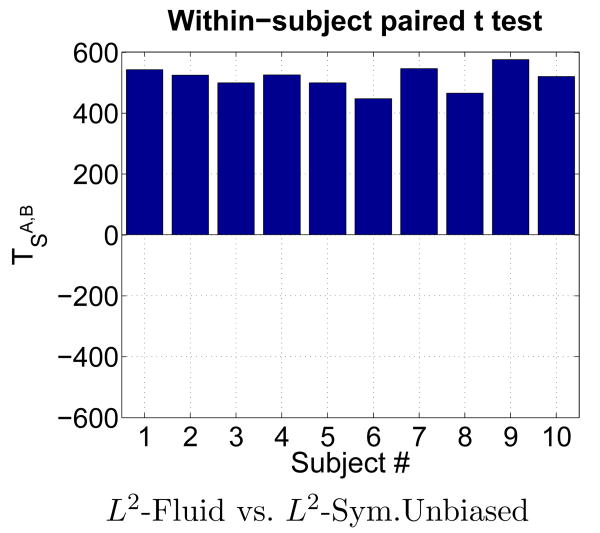
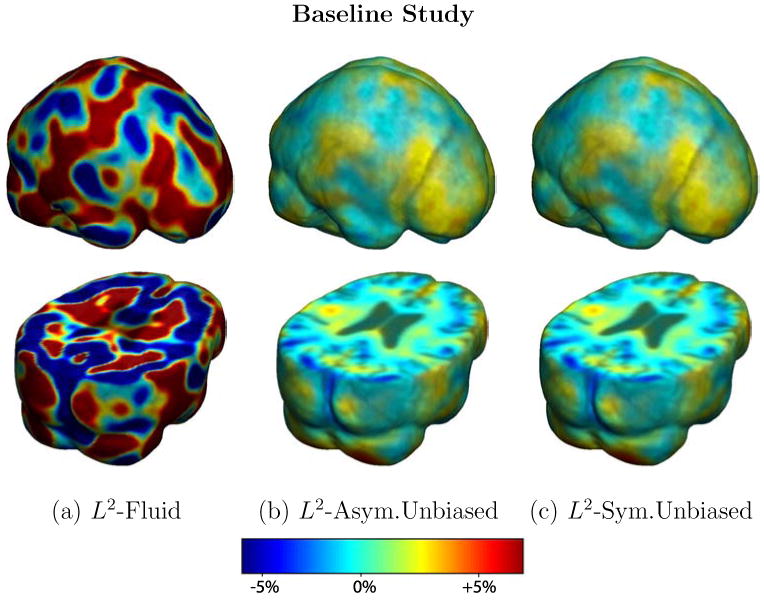
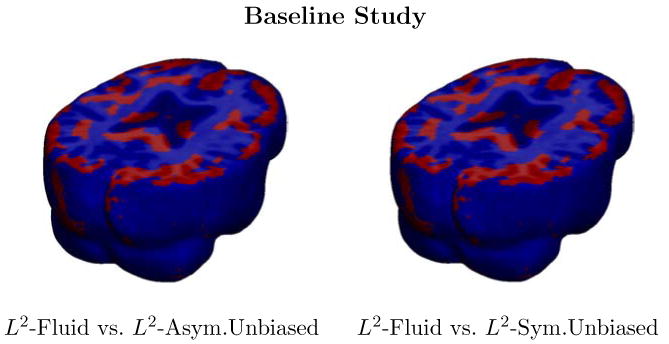
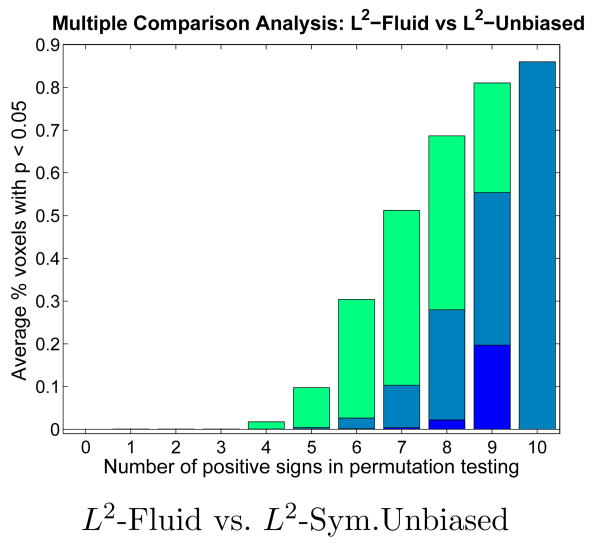
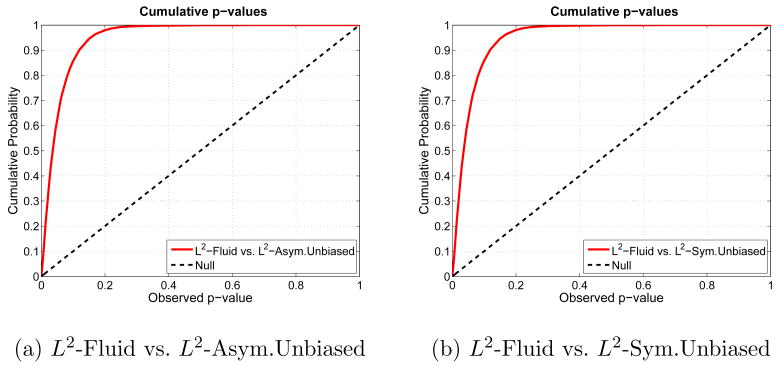
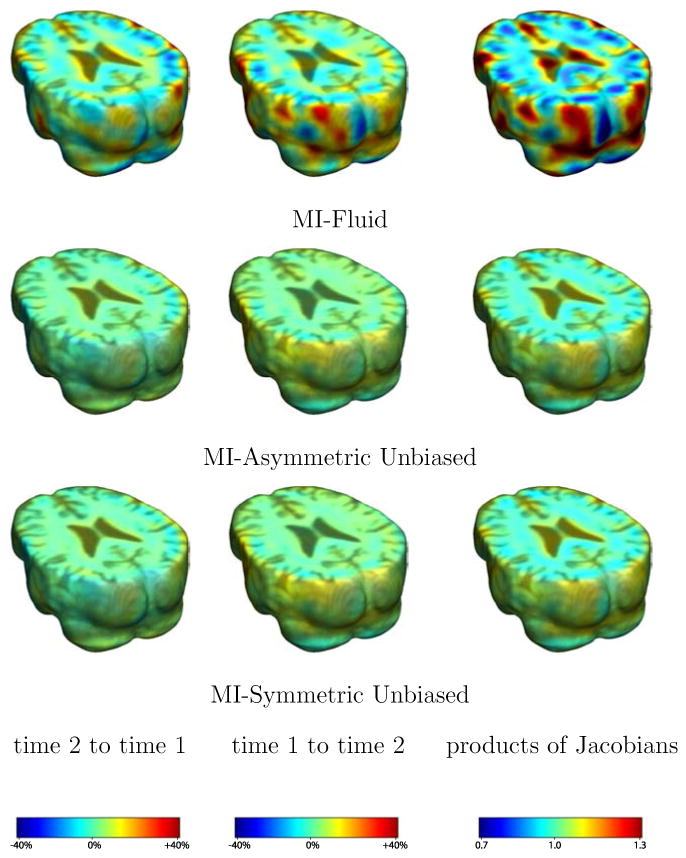
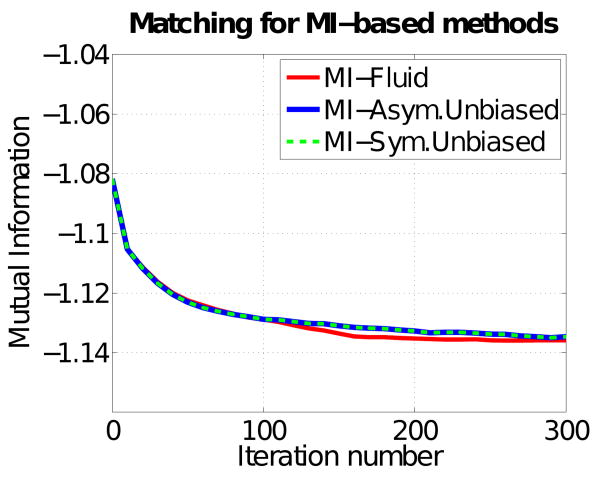
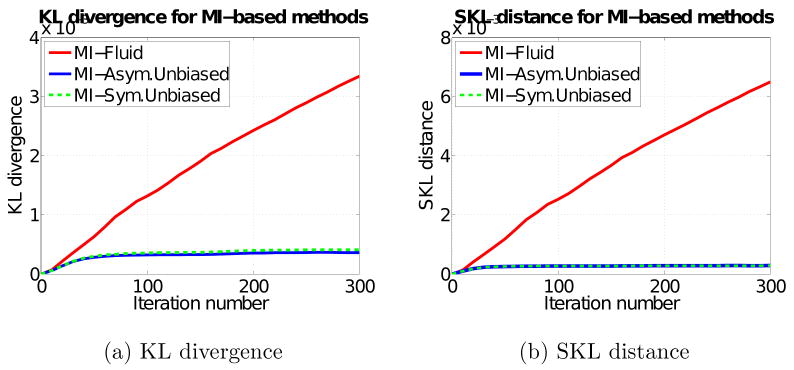
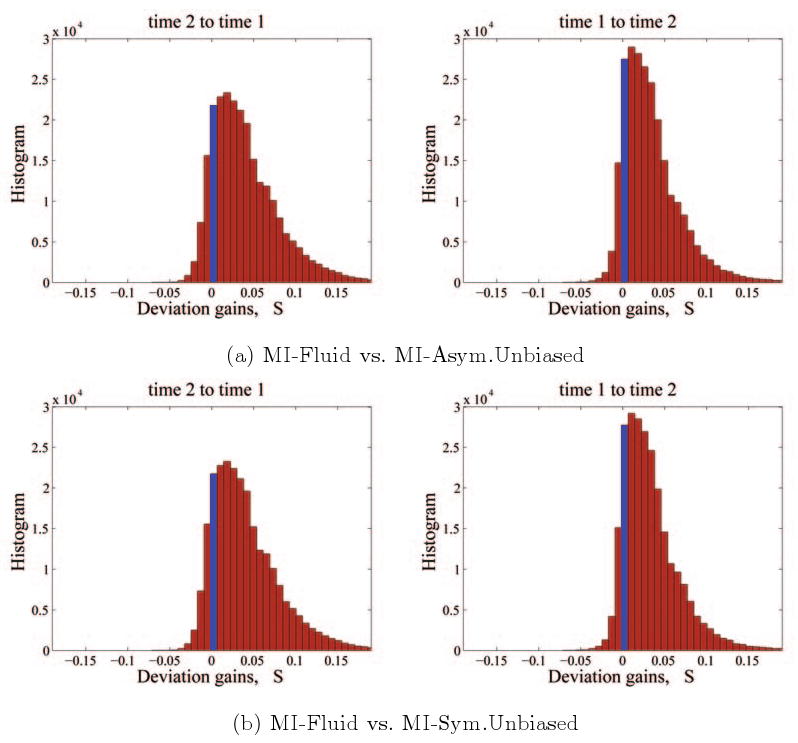
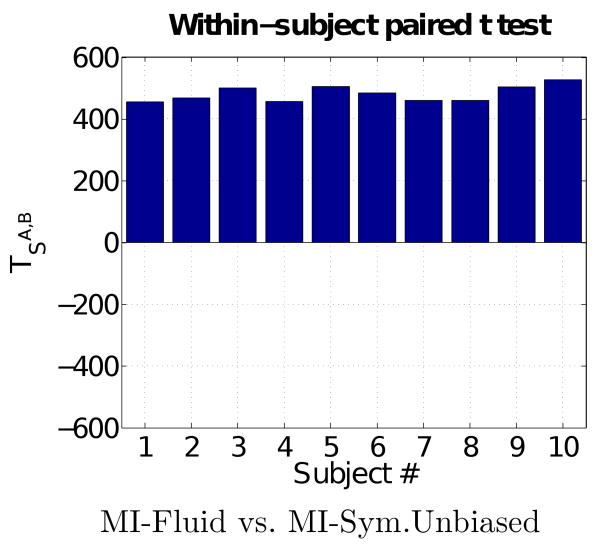
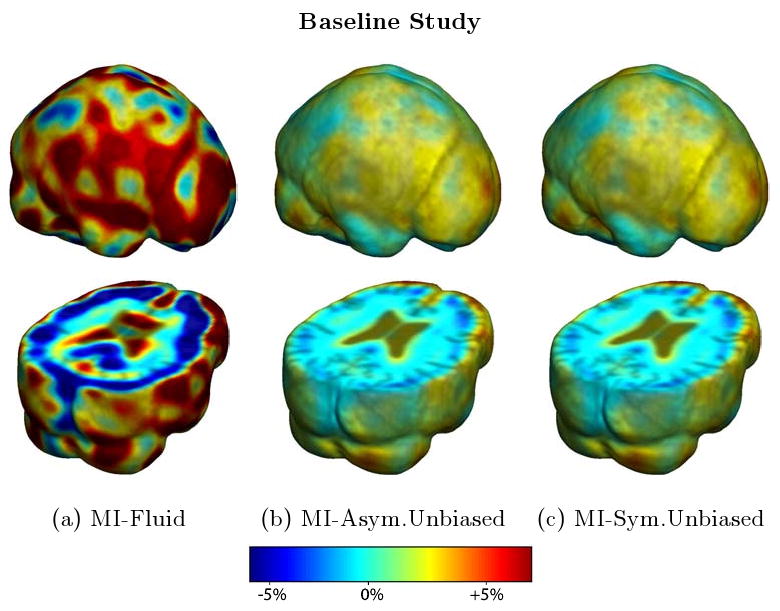
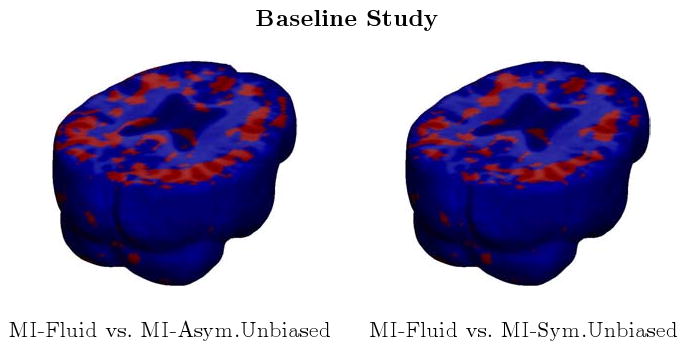
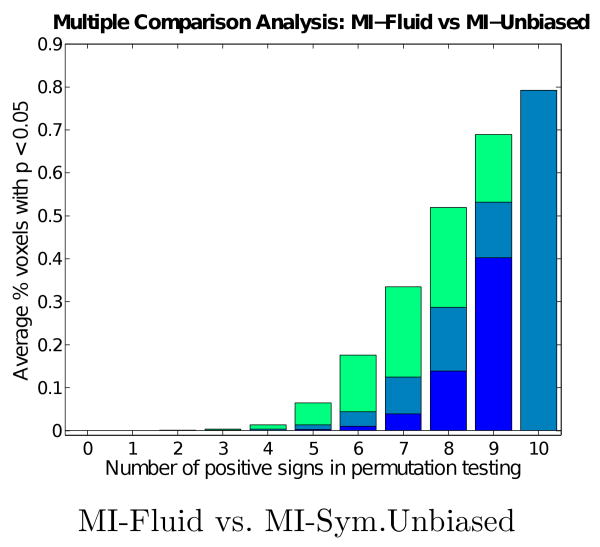
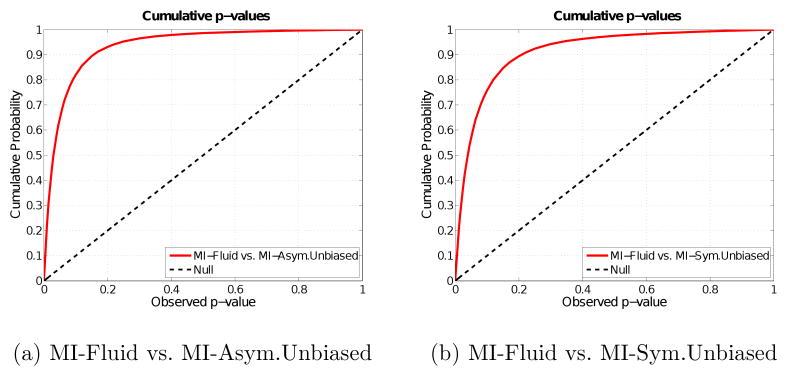
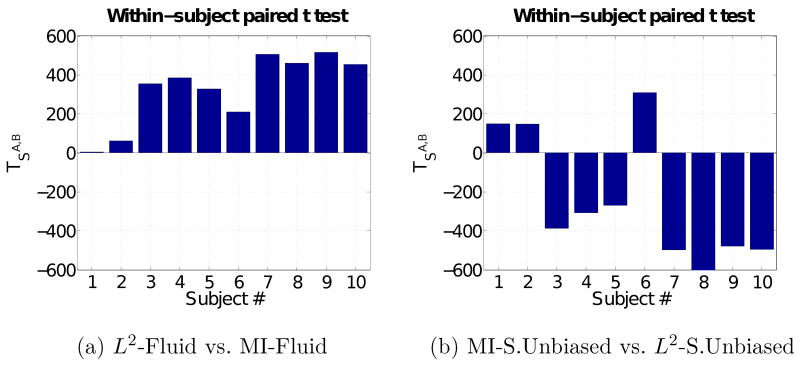
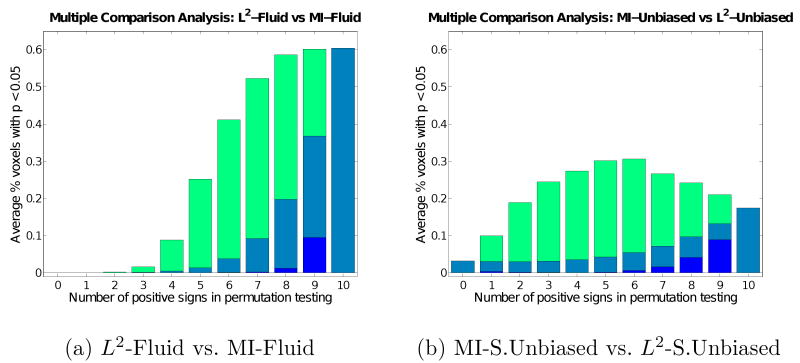
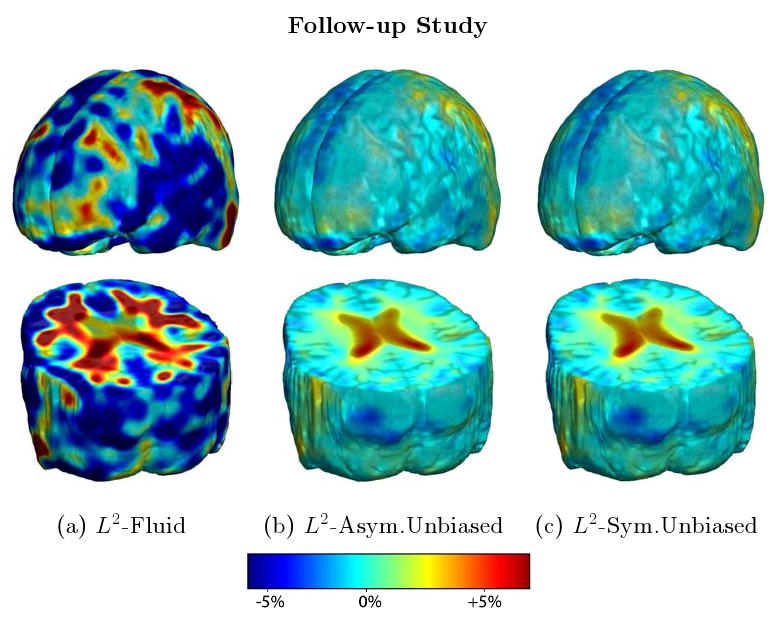
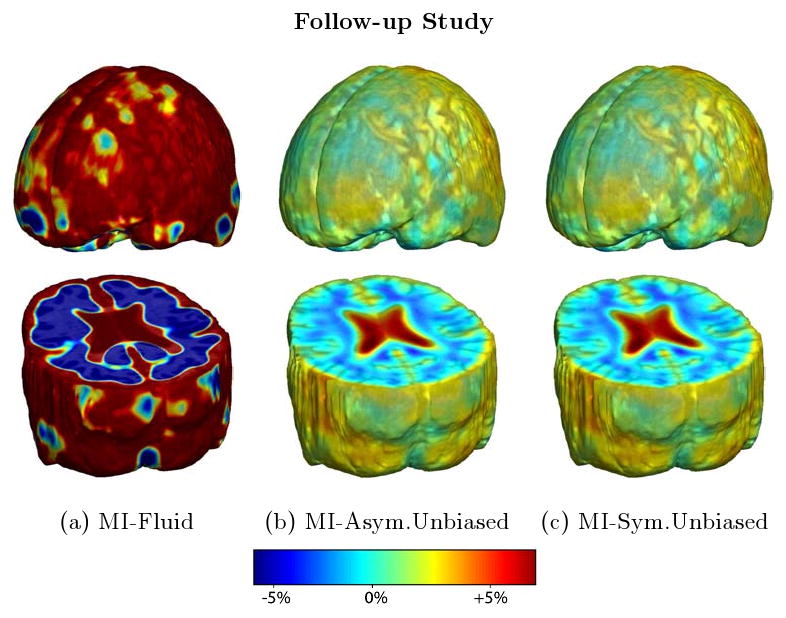
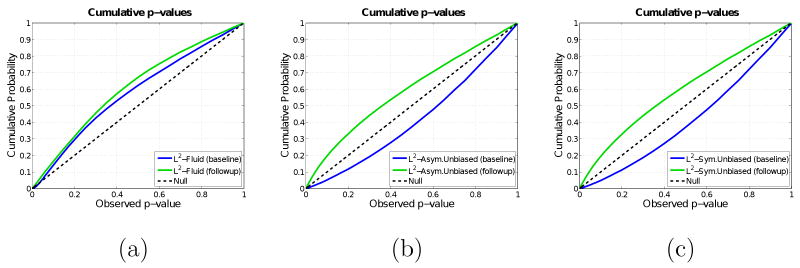
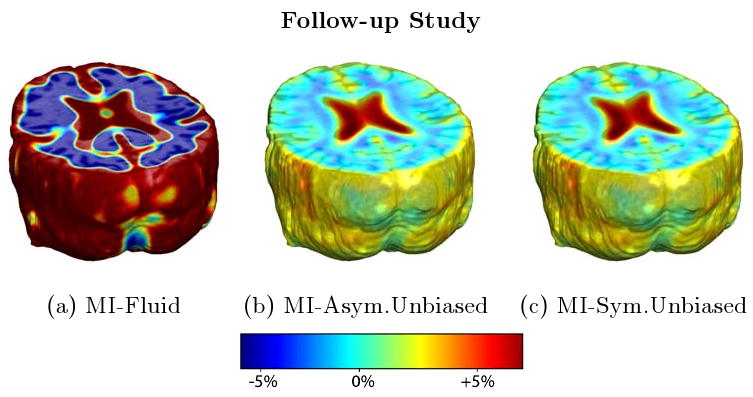
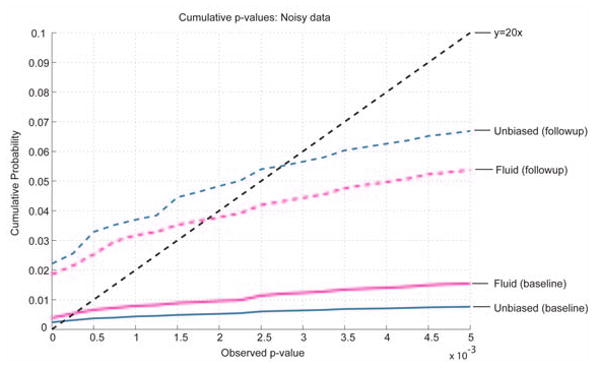
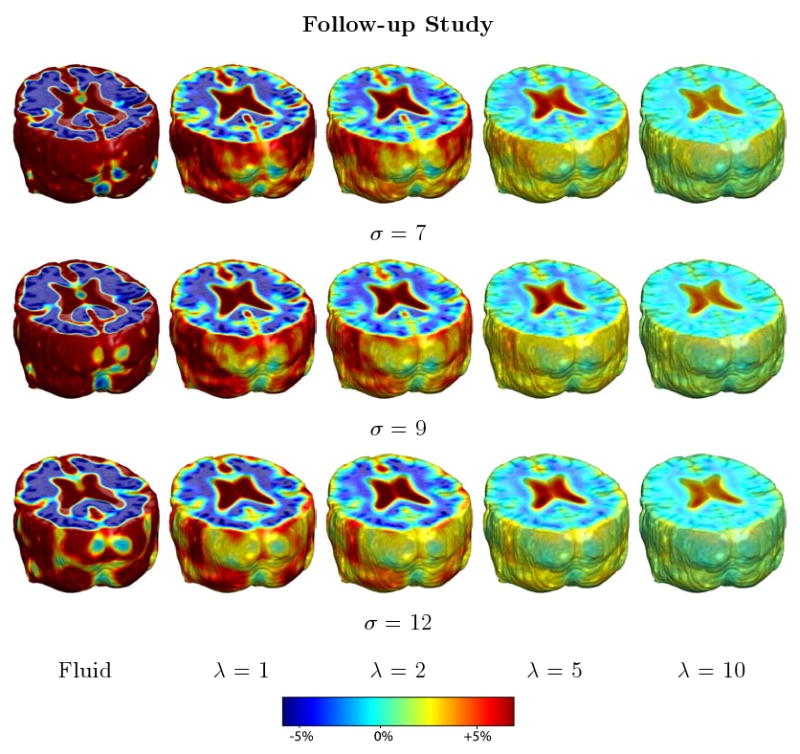
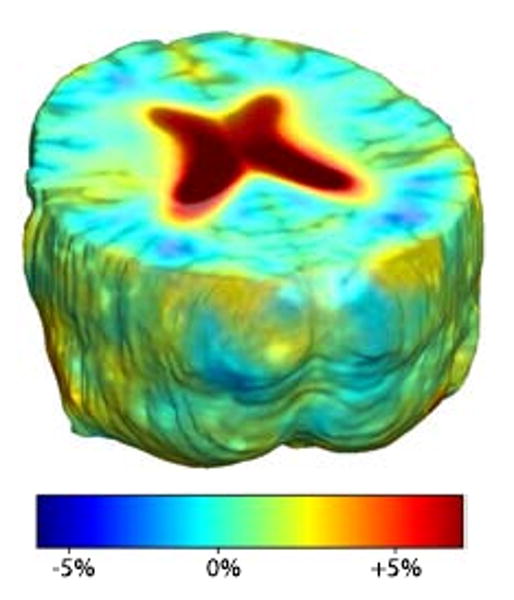
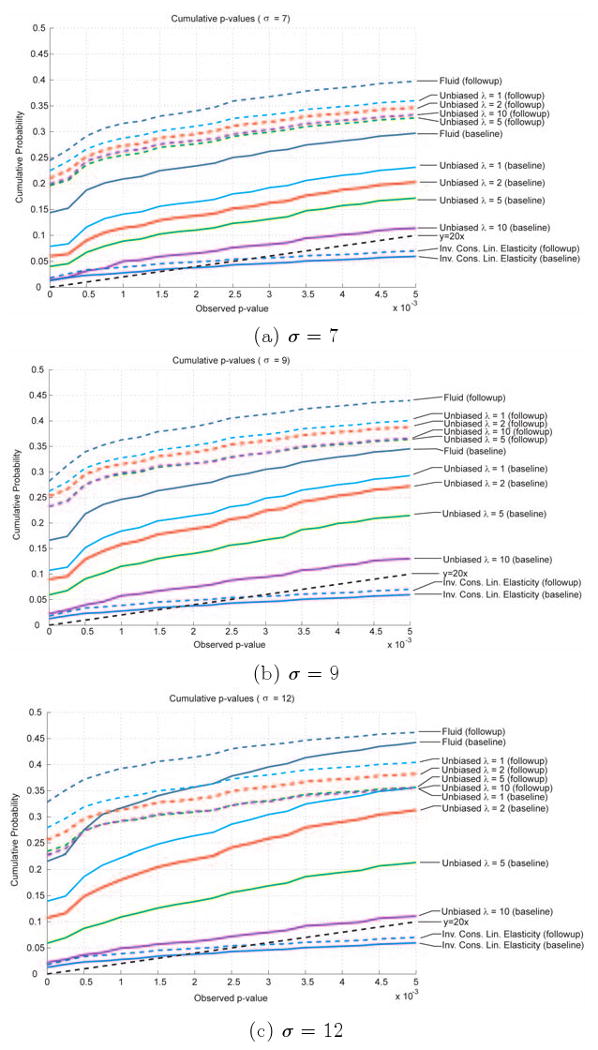
Measures of brain changes can be computed from sequential MRI scans, providing valuable information on disease progression for neuroscientific studies and clinical trials. Tensor-based morphometry (TBM) creates maps of these brain changes, visualizing the 3D profile and rates of tissue growth or atrophy. In this paper, we examine the power of different nonrigid registration models to detect changes in TBM, and their stability when no real changes are present. Specifically, we investigate an asymmetric version of a recently proposed Unbiased registration method, using mutual information as the matching criterion. We compare matching functionals (sum of squared differences and mutual information), as well as large-deformation registration schemes (viscous fluid and inverse-consistent linear elastic registration methods versus Symmetric and Asymmetric Unbiased registration) for detecting changes in serial MRI scans of 10 elderly normal subjects and 10 patients with Alzheimer's Disease scanned at 2-week and 1-year intervals. We also analyzed registration results when matching images corrupted with artificial noise. We demonstrated that the unbiased methods, both symmetric and asymmetric, have higher reproducibility. The unbiased methods were also less likely to detect changes in the absence of any real physiological change. Moreover, they measured biological deformations more accurately by penalizing bias in the corresponding statistical maps.


Figures

Fig. 1
Fig. 1
Nonrigid registration was performed on an image pair from one of the subjects from the ADNI Baseline study (serial MRI images acquired two weeks apart) using L2-Fluid (row 1), L2-Asymmetric Unbiased (row 2), and L2-Symmetric Unbiased (row 3) registration methods. Jacobian maps of deformations from time 2 to time 1 (column 1) and time 1 to time 2 (column 2) are superimposed on the target volumes. The unbiased methods generate less noisy Jacobian maps with values closer to 1; this shows the greater stability of the approach when no volumetric change is present. Column 3 examines the inverse consistency of deformation models. Products of Jacobian maps generated using all three models are shown, for forward direction (time 1 to time 2) and backward direction (time 2 to time 1). For the L2-based unbiased methods, the products of the Jacobian maps are less noisy, with values closer to 1, showing better inverse consistency.
Fig. 2
Fig. 2
Values of the L2 matching functional are shown per iteration for the L2-Fluid (solid red), L2-Asymmetric Unbiased (solid blue), and L2-Symmetric Unbiased (dashed green) methods. All methods cause the intensity mismatch measure to decrease and converge in a similar way.
Fig. 3
Fig. 3
(a) KL divergence and (b) SKL distance per iteration are shown for L2-Fluid (solid red), L2-Asymmetric Unbiased (solid blue), and L2-Symmetric Unbiased (dashed green) methods. For L2-Fluid, both KL and SKL measures increase, while for Asymmetric Unbiased and Symmetric Unbiased models both measures stabilize.
Fig. 4
Fig. 4
Histograms of voxel-wise deviation gains (a) L2-Fluid over L2-Asymmetric Unbiased and (b) L2-Fluid over L2-Symmetric Unbiased for one of the subjects for the forward direction (time 2 to time 1) and backward direction (time 1 to time 2). The histograms are skewed to the right, indicating the superiority of Asymmetric Unbiased and Symmetric Unbiased registration methods over Fluid registration. A paired t test shows significance (p < 0.0001). The histogram of the null distribution is centered at the point where the deviation gain S = 0, designated in blue.
Fig. 5
Fig. 5
Global T statistics for all ten subjects testing whether Symmetric Unbiased registration (method B) outperforms Fluid registration (method A) when coupled with L2. Here, p < 0.0001 for all subjects, indicating that the Symmetric Unbiased registration, when coupled with L2 cost functional, outperforms Fluid registration with confirmed statistical significance, producing more reproducible maps with less variability.
Fig. 6
Fig. 6
Nonrigid registration was performed on the ADNI Baseline study (serial MRI images acquired two weeks apart) of ten normal elderly subjects using L2-Fluid (column 1), L2-Asymmetric Unbiased (column 2), L2-Symmetric Unbiased (column 3) registration methods. For each method, the mean of the resulting 10 Jacobian maps is superimposed on one of the brain volumes. Visually, L2-Fluid generates a noisy mean map, while maps generated using L2-Asymmetric Unbiased and L2-Symmetric Unbiased methods are less noisy with values closer to 1. For all deformation models, regions with least stability, due to both spatial distortion and intensity inhomogeneity, are the brain stem, thalamus, and ventricles.
Fig. 7
Fig. 7
Voxel-wise paired t test for the deviation gain S empirically thresholded at 2.82 (p = 0.005 on the voxel level with 9 degrees of freedom), showing where L2-Asymmetric Unbiased and L2-Symmetric Unbiased registration outperform L2-Fluid registration (regions in red) with statistical significance on a voxel level. In contrast, there are no voxels with T values smaller than -2.82, indicating that Fluid registration does not outperform unbiased methods at any voxel. Hence, the visualization of voxel-wise paired t test with a threshold of -2.82 is omitted.
Fig. 8
Fig. 8
Multiple Comparison Analysis using permutation testing on the deviation gain S of L2-Fluid over L2-Symmetric Unbiased for baseline ADNI dataset. Each permutation randomly assigns a positive or negative sign to each of the 10 log-Jacobian maps. Here, results are plotted with respect to the number of positive signs (from 0 to 10) with 10 positive signs indicating the observed data. Dark blue, light blue, and green colors indicate the minimum, average, and maximum percentage of voxels with p < 0.05 of all possible permutations with a given number of positive signs. There is only one observation for the observed data, and thus, minimum, maximum, and average values are equal for the rightmost bar. The result indicates that out of 1024 permutations, no permutation gives a greater percentage of voxels with p < 0.05 than the observed data does. This indicates that unbiased regularization technique outperforms Fluid method with p < 0.001. Since the results obtained using Asymmetric Unbiased method are similar to those obtained using Symmetric Unbiased method, they are not shown here.
Fig. 9
Fig. 9
Cumulative distribution of p-values for the deviation gain S of (a) L2-Fluid over L2-Asymmetric Unbiased and (b) L2-Fluid over L2-Symmetric Unbiased. Here, the ADNI baseline dataset is used. In both (a) and (b), the CDF line is well above the Null line (y = x), indicating that both asymmetric and symmetric unbiased methods outperform Fluid method (i.e. less deviation) in being less likely to exhibit structural change in the absence of biological change. Note that the interval p ∈ [0, 0.005] is of most importance for observation.
Fig. 10
Fig. 10
Nonrigid registration was performed on an image pair from one of the subjects from the ADNI Baseline study (serial MRI images acquired two weeks apart) using MI-Fluid (row 1), MI-Asymmetric Unbiased (row 2), and MI-Symmetric Unbiased (row 3) registration methods. Jacobian maps of deformations from time 2 to time 1 (column 1) and time 1 to time 2 (column 2) are superimposed on the target volumes. The unbiased methods generate less noisy Jacobian maps with values closer to 1; this shows the greater stability of the approach when no volumetric change is present. Column 3 examines the inverse consistency of deformation models. Products of Jacobian maps generated using all three models are shown, for the forward direction (time 1 to time 2) and backward direction (time 2 to time 1). For the mutual information-based unbiased methods, the products of the Jacobian maps are less noisy, with values closer to 1, showing better inverse consistency.
Fig. 11
Fig. 11
Values of the mutual information matching functional are shown per iteration for the MI-Fluid (solid red), MI-Asymmetric Unbiased (solid blue), and MI-Symmetric Unbiased (dashed green) methods. Again, all methods cause the intensity mismatch measure to decrease and converge in a similar way.
Fig. 12
Fig. 12
(a) KL divergence and (b) SKL distance per iteration are shown for the MI-Fluid (solid red), MI-Asymmetric Unbiased (solid blue), and MI-Symmetric Unbiased (dashed green) methods. For MI-Fluid, both KL and SKL measures increase, while for Asymmetric Unbiased and Symmetric Unbiased models both measures stabilize.
Fig. 13
Fig. 13
Histograms of voxel-wise deviation gains (a) MI-Fluid over MI-Asymmetric Unbiased and (b) MI-Fluid over MI-Symmetric Unbiased for one of the subjects, for the forward direction (time 2 to time 1) and backward direction (time 1 to time 2). The histograms are skewed to the right, indicating the superiority of Asymmetric Unbiased and Symmetric Unbiased registration methods over Fluid registration. Paired t test shows significance (p < 0.0001). The histogram of the null distribution is centered at the point where the deviation gain S = 0, designated in blue.
Fig. 14
Fig. 14
Global T statistics for all ten subjects testing whether Symmetric Unbiased registration (method B) outperforms Fluid registration (method A) when coupled with mutual information. Here, p < 0.0001 for all subjects, indicating that the Symmetric Unbiased registration, when coupled with MI matching cost functional, outperforms Fluid registration with confirmed statistical significance, producing more reproducible maps with less variability.
Fig. 15
Fig. 15
Nonrigid registration was performed on the ADNI Baseline study (serial MRI images acquired two weeks apart) of ten normal elderly subjects using MI-Fluid (column 1), and MI-Asymmetric Unbiased (column 2), and MI-Symmetric Unbiased (column 3) registration methods. For each method, the mean of the resulting 10 Jacobian maps is superimposed on one of the brain volumes. Visually, MI-Fluid generates a noisy mean map, while maps generated using MI-AU and MI-Symmetric Unbiased methods are less noisy with values closer to 1. For both deformation models, regions with least stability, due to both spatial distortion and intensity inhomogeneity, are the brain stem, thalamus, and ventricles.
Fig. 16
Fig. 16
Voxel-wise paired t test for the deviation gain S empirically thresholded at 2.82 (p = 0.005 on the voxel level with 9 degrees of freedom), showing where MI-Asymmetric Unbiased and MI-Symmetric Unbiased registration outperform MI-Fluid registration (regions in red) with statistical significance on a voxel level. In contrast, there are no voxels with T values smaller than -2.82, indicating that Fluid registration does not outperform unbiased methods at any voxel. Hence, the visualization of voxel-wise paired t test with a threshold of -2.82 is omitted.
Fig. 17
Fig. 17
Multiple Comparison Analysis using permutation testing on the deviation gain S of MI-Fluid over MI-Symmetric Unbiased, for baseline ADNI dataset. See caption of Figure 8 for interpretation of the results.
Fig. 18
Fig. 18
Cumulative distribution of p-values for the deviation gain S of (a) MI-Fluid over MI-Asymmetric Unbiased and (b) MI-Fluid over MI-Symmetric Unbiased. Here, ADNI baseline dataset is used. In both (a) and (b), the CDF line is well above the Null line, indicating that both asymmetric and symmetric unbiased methods outperform Fluid method in being less likely to exhibit structural change in the absence of biological change. Note that the interval p ∈ [0, 0.005] is of most importance for observation.
Fig. 19
Fig. 19
Global T statistics for all ten subjects testing (a) whether MI-Fluid (method B) outperforms L2-Fluid (method A), and (b) whether L2-Symmetric Unbiased (method B) outperforms MI-Symmetric Unbiased (method A). MI-Fluid outperforms L2-Fluid with p < 0.0001. However, the result of the comparison of L2-Symmetric Unbiased and MI-Symmetric Unbiased is inconclusive.
Fig. 20
Fig. 20
Multiple Comparison Analysis using permutation testing on the deviation gain S of (a) L2-Fluid over MI-Fluid and (b) MI-Symmetric Unbiased over L2-Symmetric Unbiased, both for baseline ADNI dataset. Each permutation randomly assigns positive or negative sign to each of the 10 log-Jacobian maps. Here, results are plotted with respect to the number of positive signs (from 0 to 10) with 10 positive signs indicating the observed data. Dark blue, light blue, and green colors indicate the minimum, average, and maximum percentage of voxels with p < 0.05 of all possible permutations with a given number of positive signs. There is only one observation for the observed data, and thus, minimum, maximum, and average values are equal for the rightmost bar. The result in (a) indicates that out of 1024 permutations, no permutation gives a greater percentage of voxels with p < 0.05 than the observed data does. This indicates that MI-Fluid method outperforms L2-Fluid method with p < 0.001. However, the comparison of MI-Symmetric Unbiased and L2-Symmetric Unbiased in (b) is inconclusive. Since the results obtained using Asymmetric Unbiased method are similar to those obtained using Symmetric Unbiased method, they are not shown here.
Fig. 21
Fig. 21
Nonrigid registration was performed on the ADNI Follow-up study (serial MRI images acquired 12 months apart) using L2-Fluid (column 1), L2-Asymmetric Unbiased (column 2), and L2-Symmetric Unbiased (column 3) registration methods. For each method, the mean of the resulting 10 Jacobian maps is superimposed on one of the brain volumes. Visually, L2-Fluid generates a noisy mean map, while maps generated using the L2-Asymmetric Unbiased and L2-Symmetric Unbiased methods suggest a volume reduction in gray matter as well as ventricular enlargement.
Fig. 22
Fig. 22
Nonrigid registration was performed on the ADNI Follow-up study (serial MRI images of patients with Alzheimer's disease acquired 12 months apart) using MI-Fluid (column 1), MI-Asymmetric Unbiased (column 2), and MI-Symmetric Unbiased (column 3) registration methods. For each method, the mean of the resulting 10 Jacobian maps is superimposed on one of the brain volumes. Visually, MI-Fluid generates a noisy mean map, while the map generated using MI-Asymmetric Unbiased and MI-Symmetric Unbiased methods suggest a volume reduction in gray matter as well as ventricular enlargement.
Fig. 23
Fig. 23
Cumulative distribution of p-values for the voxelwise log Jacobian t-maps (as defined in Equation (34)) for both ADNI Baseline (in blue) and Follow-up (in green) using (a) L2-Fluid, (b) L2-Asymmetric Unbiased, and (c) L2-Symmetric Unbiased methods. Here, a better method should separate these two CDF plots (see Section 5.4), indicating a real biological change has occurred between these two time points. Hence, L2-Asymmetric Unbiased and L2-Symmetric Unbiased methods outperform L2-Fluid method. Note that the interval p ∈ [0,0.005] is of most importance for observation.
Fig. 24
Fig. 24
Nonrigid registration was performed on the ADNI Follow-up study images artificially corrupted with Gaussian noise (mean zero; variance 12.0). For each method, the mean of the resulting 10 Jacobian maps is superimposed on one of the brain volumes.
Fig. 25
Fig. 25
Random Gaussian noise (zero mean; variance 12.0) was added to ADNI Baseline and Follow-up datasets. Cumulative distributions of p-values for the voxelwise log Jacobian t-maps for Baseline (solid lines) and Follow-up (dashed lines) using Fluid and Unbiased methods are displayed. Here, Unbiased methods show a bigger separation between the baseline and follow-up curves, indicating that they were able to better differentiate between the two datasets.
Fig. 26
Fig. 26
Nonrigid registration was performed on the ADNI Follow-up study using Fluid and Unbiased registration methods with different values of λ and σ. For each method, the mean of the resulting 10 Jacobian maps is superimposed on one of the brain volumes. Fluid and Unbiased registration with smaller λ values generate noisier mean maps, while maps generated using Unbiased registration with larger λ values suggest a volume reduction in gray matter as well as ventricular enlargement. As the value of the smoothing parameter σ increases, the resulting Jacobian maps become smoother, making the biological effects, such as reduction in gray matter, harder to detect.
Fig. 27
Fig. 27
Inverse-consistent linear elastic registration was performed on the ADNI Follow-up study. The mean of the resulting 10 Jacobian maps is superimposed on one of the brain volumes.
Fig. 28
Fig. 28
Cumulative distributions of p-values for the voxelwise log Jacobian t-maps for both ADNI Baseline (solid lines) and Follow-up (dashed lines) using Fluid, Inverse-Consistent Linear Elasticity, and Unbiased methods with different sets of parameters of λ and (a) σ = 7, (b) σ = 9, and (c) σ = 12. Unbiased methods, especially with larger values of λ, show a bigger separation between the baseline and follow-up curves than Fluid and Inverse-Consistent Linear Elasticity methods do, indicating that Unbiased methods were able to better differentiate between the two datasets.

Similar articles

Cited by

References

    1. Avants B, Gee JC. Geodesic estimation for large deformation anatomical shape averaging and interpolation. NeuroImage. 2004;23 1:S139–50. - PubMed
    1. Beg M, Miller M, Trouve A, Younes L. Computing large deformation metric mappings via geodesic flows of diffeomorphisms. International Journal of Computer Vision. 2005;61(2):139–157.
    1. Benjamini Y, Hochberg Y. Controlling the false discovery rate: A practical and powerful approach to multiple testing. Journal of the Royal Statistical Society B. 1995;57(1):289–300.
    1. Broit C. PhD thesis. University of Pennsylvania; 1981. Optimal registration of deformed images.
    1. Brun C, Lepore N, Pennec X, Chou Y, Lopez O, Aizenstein H, Becker J, Toga A, Thompson P. Comparison of standard and Riemannian elasticity for tensor-based morphometry in HIV/AIDS. International Conference on Medical Image Computing and Computer Assisted Intervention.2007. - PubMed

Publication types