. 2009 Oct;219(2):562-73.
doi: 10.1016/j.expneurol.2009.07.016. Epub 2009 Jul 23.

Neurokinins inhibit low threshold inactivating K+ currents in capsaicin responsive DRG neurons

Affiliations

Neurokinins inhibit low threshold inactivating K+ currents in capsaicin responsive DRG neurons

Adrian Sculptoreanu et al. Exp Neurol. 2009 Oct.

Abstract

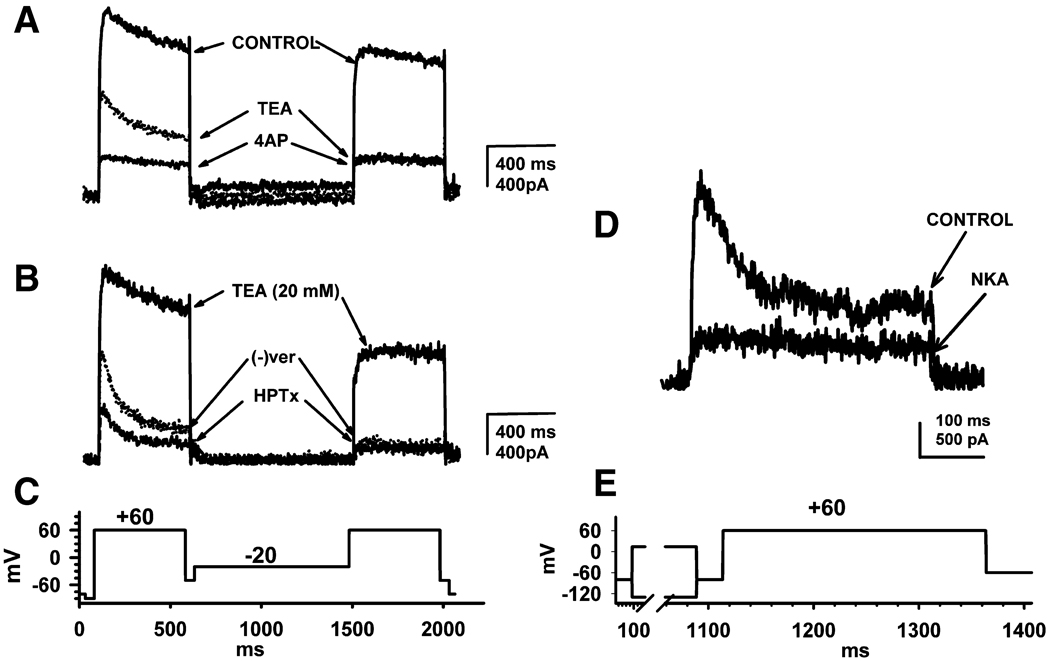
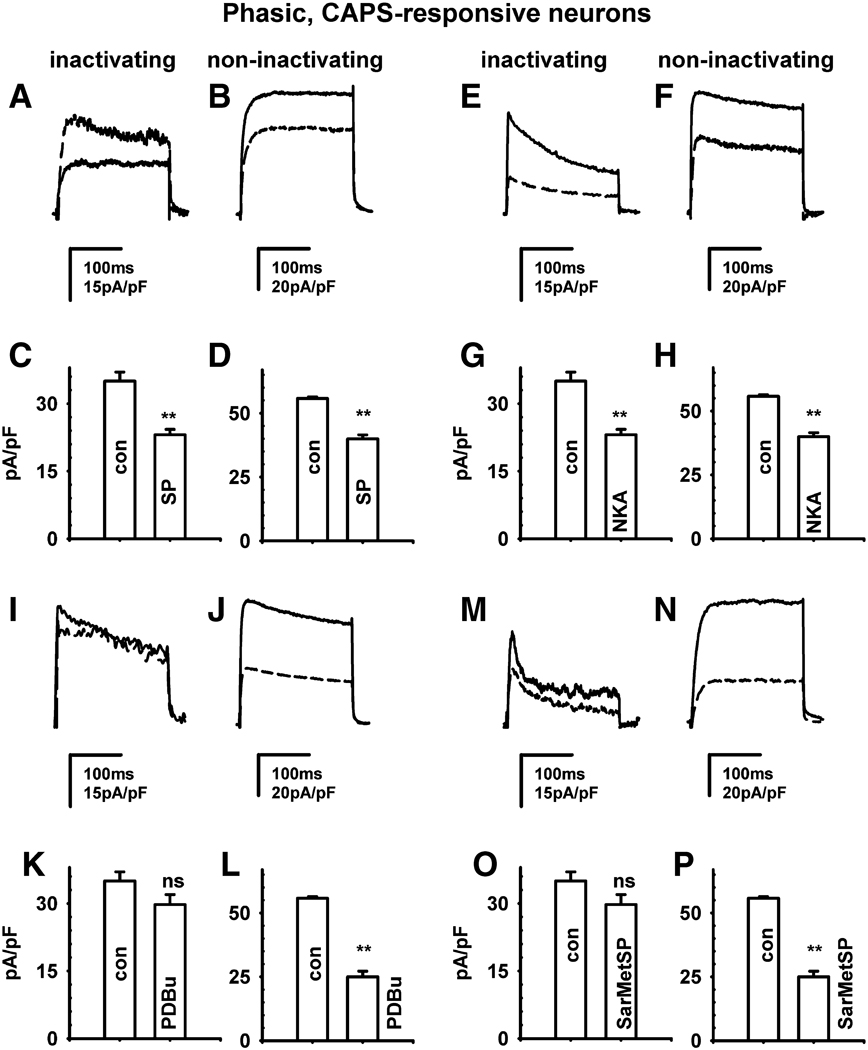
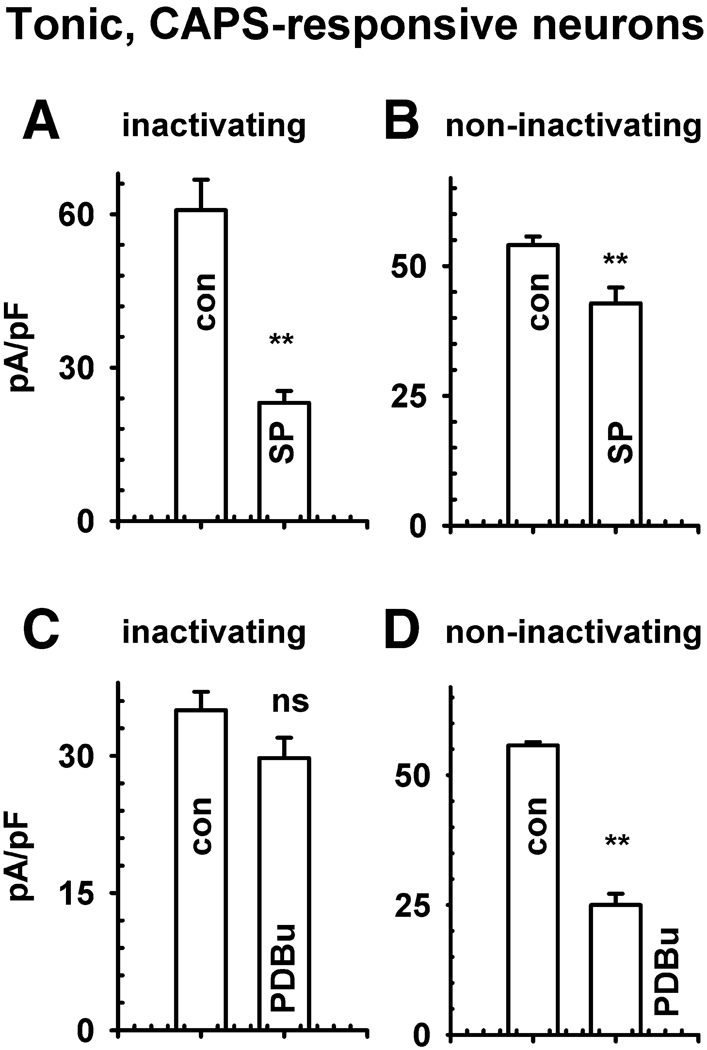
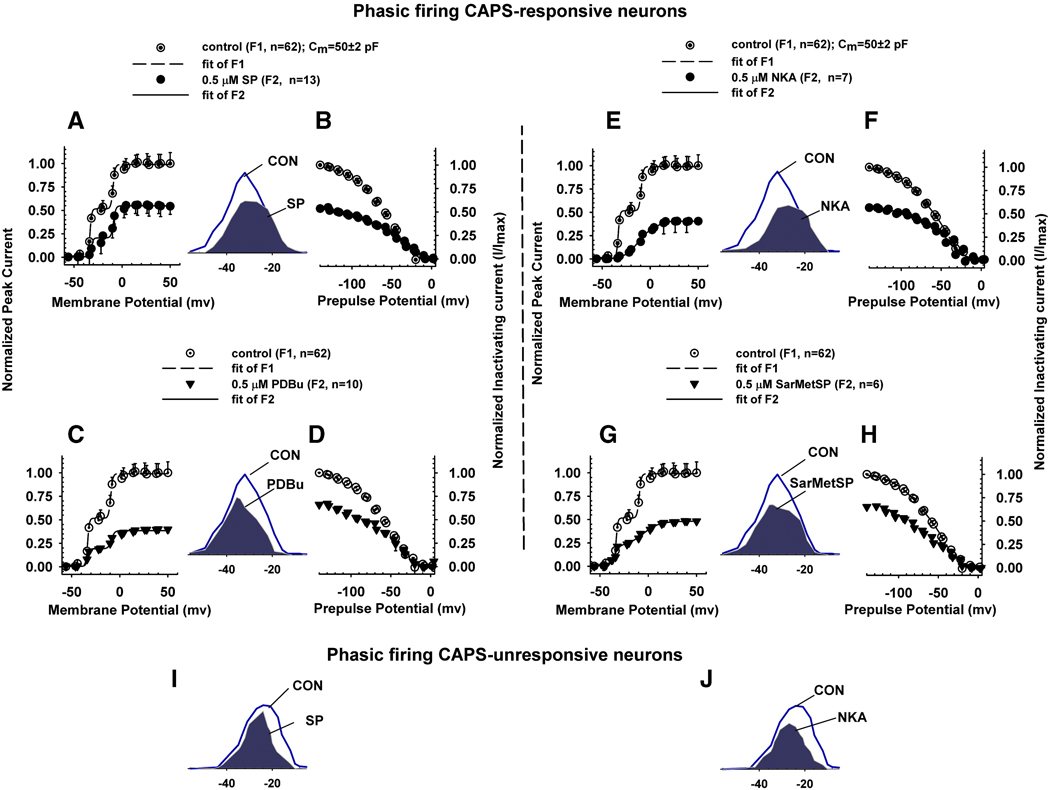
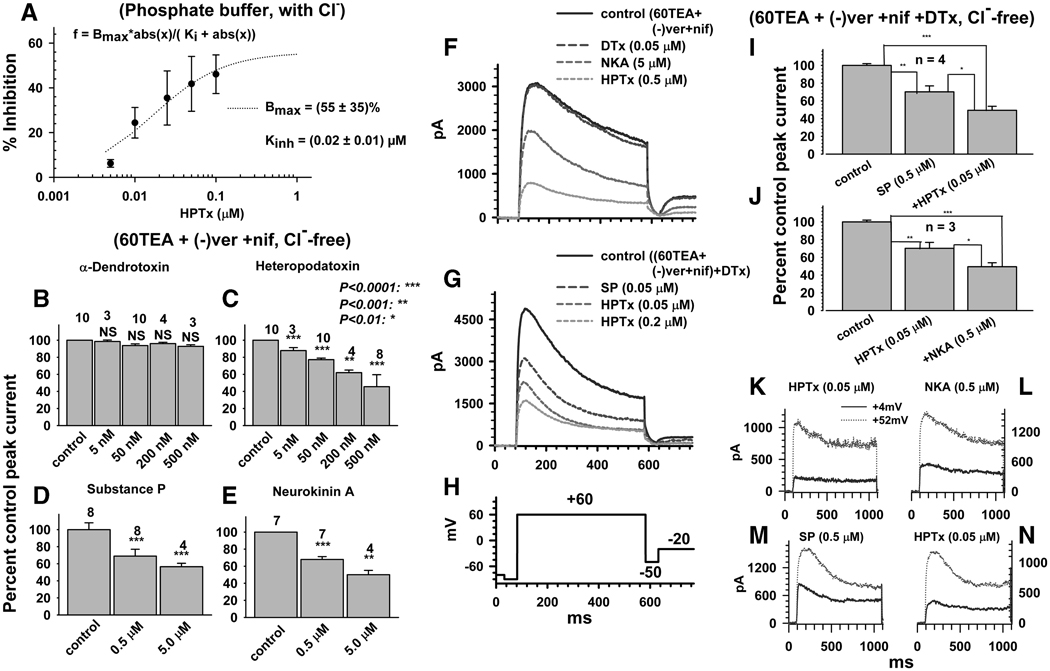
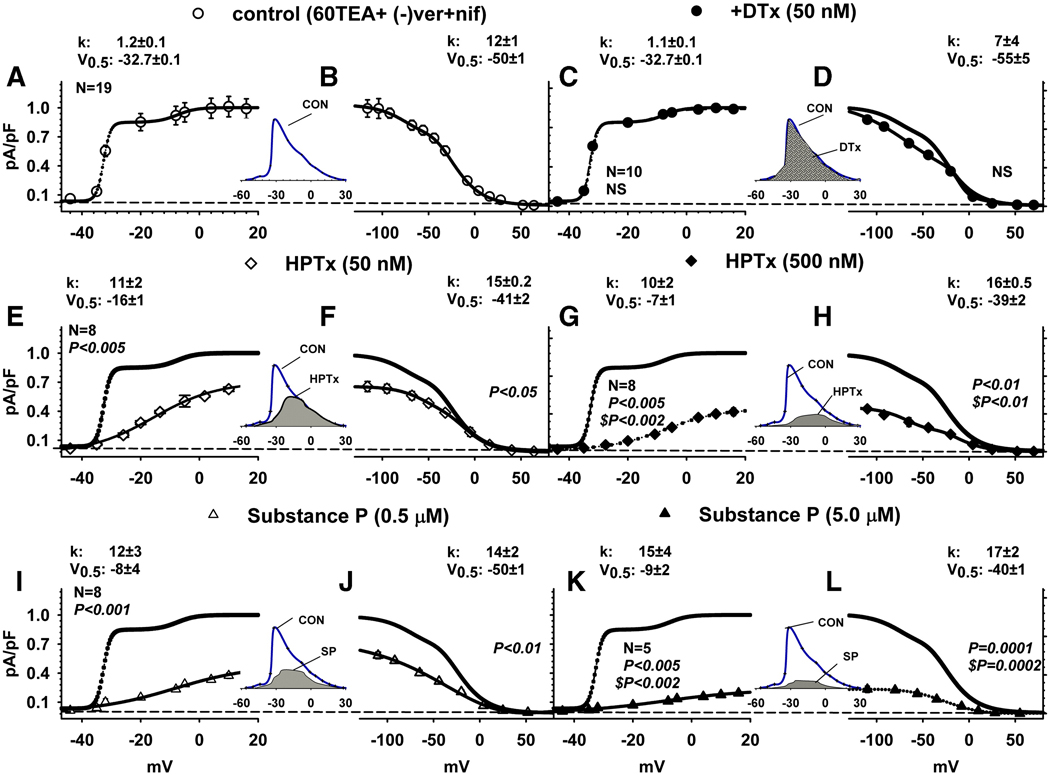
Neurokinins (NK) released from terminals of dorsal root ganglion (DRG) neurons may control firing of these neurons by an autofeedback mechanism. In this study we used patch clamp recording techniques to determine if NKs alter excitability of rat L4-S3 DRG neurons by modulating K(+) currents. In capsaicin (CAPS)-responsive phasic neurons substance P (SP) lowered action potential (AP) threshold and increased the number of APs elicited by depolarizing current pulses. SP and a selective NK(2) agonist, [betaAla(8)]-neurokinin A (4-10) also inhibited low threshold inactivating K(+) currents isolated by blocking non-inactivating currents with a combination of high TEA, (-) verapamil and nifedipine. Currents recorded under these conditions were heteropodatoxin-sensitive (Kv4 blocker) and alpha-dendrotoxin-insensitive (Kv1.1 and Kv1.2 blocker). SP and NKA elicited a >10 mV positive shift of the voltage dependence of activation of the low threshold currents. This effect was absent in CAPS-unresponsive neurons. The effect of SP or NKA on K(+) currents in CAPS-responsive phasic neurons was fully reversed by an NK(2) receptor antagonist (MEN10376) but only partially reversed by a PKC inhibitor (bisindolylmaleimide). An NK(1) selective agonist ([Sar(9), Met(11)]-substance P) or direct activation of PKC with phorbol 12,13-dibutyrate, did not change firing in CAPS-responsive neurons, but did inhibit various types of K(+) currents that activated over a wide range of voltages. These data suggest that the excitability of CAPS-responsive phasic afferent neurons is increased by activation of NK(2) receptors and that this is due in part to inhibition and a positive voltage shift in the activation of heteropodatoxin-sensitive Kv4 channels.


Figures

Fig. 1
Fig. 1
Effect of neurokinins on firing and K+ currents in capsaicin responsive (CR) DRG neurons. Action potentials generated in two different in CAPS-responsive (CR) phasic DRG neurons by rectangular current pulse injections 5 ms in duration and 200 pA (A, D) or 50 pA (B, E) in intensity, followed by a 100 ms interpulse at the holding potential and a second pulse of the same intensity as the first in the sequence, 600 ms in duration. Control recordings before treatment (A, B) and the enhancement of firing by substance P (SP, 0.5 µM, B) or by heteropodatoxin II (HPTx, 0.05 µM, E). SP (D) and HPTx (E) significantly increased the number of action potentials (APs) triggered by the second pulse in the sequence without significantly altering the duration of single AP triggered by the first brief pulse. C, Inward current evoked by CAPS (0.5 µM) is blocked by a TRPV1 antagonist (TRPV1-Ant, 5 µM). F, Total K+ currents activated by a test pulse to +60 mV from a holding potential of −80 mV were partially blocked by SP (0.5 µM) and the NK2 (0.5 µM) selective antagonist MEN10376 reversed the inhibitory effect of SP in the same cell shown in C. H, Summary of the effects of substance P or a selective NK2 agonist, [βAla8]-neurokinin A (4–10) (NKA, 0.5 µM) on total K+ currents in CR phasic DRG neurons and reversal of the effects by the NK2 (0.5 µM) selective antagonist MEN10376. Scale bar in A, B, D and E is 20 ms for the first action potential in the sequence and 100 ms for the second long stimulus pulse. Scale bars in F are 100 ms and 500 pA and in H are 5 pA/pF and 2 min.
Fig. 2
Fig. 2
Pharmacological and voltage separation of inactivating and non-inactivating potassium-currents in CR phasic DRG neurons. A, B, Total outward-currents (on the left) and inactivating-currents (on the right) elicited by the multi pulse stimulation protocol shown in panel C. A, TEA (20 mM) partially reduces total outward currents before prepulse leaving a residual fast inactivating current and reduces by >70% the non-inactivating current after prepulse. Subsequent application of 4-AP (50 µM) blocks >50% of the TEA-resistant total currents before prepulse but does not alter the residual TEA-resistant non-inactivating currents after prepulse. B. In the presence of TEA (20 mM), which reduced the total outward current before prepulse and markedly reduced the non-inactivating current after prepulse, (−) verapamil ((−) ver, 5 µM) reduces by >70% the TEA-resistant non-inactivating current after pre-pulse and unmasks a more rapidly inactivating current before prepulse. In the presence of TEA and (−) verapamil, application of HPTx (0.05 µM), reduces by >50% the currents activated before prepulse but has no effect on the non-inactivating currents after prepulse. C,. D, Effect of a selective NK2 agonist [βAla8]-neurokinin A (4–10) (NKA) on inactivating K+ currents in a CR phasic DRG neuron measured using the stimulation protocol shown in panel E. NKA largely inhibited (5µM, D) the inactivating current obtained by subtraction of non-inactivating currents from the total currents. The difference between the two currents is represented by the fast inactivating current labeled "CONTROL" in D and by the residual non-inactivating current after block by NKA. Records in A, B and D were obtained from three different CR phasic neurons. Scale bars to the right of current traces A and B are 400 ms and 400 pA; scale bar below the current trace in D is 100 ms and 500 pA.
Fig. 3
Fig. 3
Effect of neurokinins and a phorbol ester on K+ currents in CR phasic neurons. Effects of substance P (SP, A, B, C, D); [βAla8]-neurokinin A (4–10) (NKA, E, F, G, H), a protein kinase C activator, phorbol 12,13-dibutyrate (PDBu, 0.5 µM, I, J, K, L) and a selective NK1 agonist, [Sar9, Met11]-substance P (Sar-MetSP, M, N, O, P) on phasic CR DRG neurons. Inactivating currents were obtained by subtraction of non-inactivating currents from the total currents using a stimulus protocol as described in Fig. 2 E. Non-inactivating currents are the currents generated by a test pulse to +60 mV after a prepulse to +4 mV. The upper tracing in each panel represents the control recording and the lower tracing is the current recorded after the various agents. Effects on inactivating K+ currents of SP (A), NKA (E), PDBu (I) and Sar-MetSP (M). C, G, K, O, Averages of peak amplitude in control and after drugs obtained from similar experiments as in A, E, I, M in response to SP (n = 13), NKA (n = 7), PDBu (n = 10) and Sar-MetSP (n = 6). B, F, J, N, Effects of SP (B), NKA (F), PDBu (J) and Sar-MetSP (N) on non-inactivating K+ currents. D, H, K, P, Averages of peak amplitude in control and after drugs obtained from similar experiments as in B, F, J, N in response to SP (n = 13), NKA (n = 7), PDBu (n = 10) and Sar-MetSP (n = 6). Statistical difference using a two tailed t-test, unequal variance difference: *P<0.05, **P<0.01; ns, not significant. Scale bars in A, E, I, M is 15 pA/pF and 100 ms and 20 pA/pF and 100 ms in B, F, J, N.
Fig. 4
Fig. 4
Effect of substance P and a phorbol ester on K+ currents in CR tonic neurons. Effects of substance P (SP, A–B) and phorbol 12, 13-dibutyrate (PDBu, C–D) in CR tonic DRG neurons. A, C. Averages of peak amplitudes of inactivating K+ currents in control (con) conditions before drugs and after SP (0.5 µM, A, n = 6) and PDBu (0.5 µM, E, n = 4). B, D, Averages of peak amplitudes of non-inactivating currents in control (con) and a SP (B) or PDBu (D) in the same experiments as in A and C. Stimulus protocols were the same as described in Fig. 3. Statistical difference using a two tailed t-test, unequal variance difference: * P<0.05, ** P<0.01; ns, not significant.
Fig. 5
Fig. 5
Effect of drugs on current-voltage relationship of activation and inactivation of K+ currents in CR phasic neurons. Activation curves (A, C, E, G) for total outward currents and inactivation curves (B, D, F, H) of inactivating outward currents obtained by subtracting the non-inactivating currents from total currents in CR phasic neurons. Activation curves of LT and HT currents (see Methods) were generated by the first test pulse of a range of intensities 1000 ms in duration (Fig. 2 E) of a two pulse activation-inactivation protocol. Inactivation curve was measured as peak outward current during a second test pulse to +60 mV, 200 ms in duration following the first 1000 ms test pulse to a range of voltages and preceded by a brief interpulse interval (23 ms). Data for activation curves are average peak current density (pA/pF) normalized to α(V/25)[exp((V−EK)/25)]/[exp(V/25)−1], where α is a normalization factor (same for all points) chosen so that the average of the results at +38, +40, … +50 mV was unity in control or a fraction of unity after block with various drugs (see Methods). A–H. Effect of SP (A, B), PDBu (C, D), NKA (E, F) and Sar-MetSP (G, H) on the activation (A, C, E, G) and inactivation (B, D, F, H). Data was fitted by a sum of two Boltzmann equations, as explained in the Methods section. SP (A, filled circles, n = 13) inhibited total K+ currents and changed the voltage dependence of activation. SP (B, filled circles) selectively inhibited low threshold inactivating currents and changed the voltage dependence of inactivation. PDBu (C, filled triangles, n = 10) had no significant effect on low threshold inactivating currents and inhibited high threshold K+ currents. PDBu (D, filled triangles) inhibited inactivating currents and changed their voltage dependence. NKA (E, filled circles, n = 7) inhibited the low threshold component of the total K+ currents and changed their voltage dependence. NKA (F, filled circles) inhibited the inactivating currents. Sar-MetSP (G, filled triangles, n = 6) inhibited the high threshold component of the total K+ currents to a larger extent than the low threshold currents and changed the voltage dependence of activation. Sar-MetSP (H, filled triangles) inhibited the high threshold component of the inactivating currents. Insets between A, B; E, F; C, D; and G, H are scaled up overlaps between activation and inactivation curves (window currents) before (line) and after addition of drugs (shaded). See Table 2 and Table 3 for quantitative measurements of activation and inactivation. I, J, In CU phasic neurons SP and NKA did not shift the voltage dependence of the early phase of activation. For simplicity only window currents in control experiments and after addition of drugs are shown.
Fig. 6
Fig. 6
Effect of K+ blockers and neurokinins on pharmacologically isolated low threshold inactivating K+ currents. A, Concentration dependence of HPTx block of total K+ currents recorded in phosphate buffer saline and normal pipette solution. In all subsequent panels Cl was substituted with methylsulfonate and 60 mM of extracellular Na+ was replaced with 60 mM TEA. B–E, Concentration dependence of the effects of DTx (B), HPTx (C), SP (D) and NKA (E) on K+ current recorded after addition of 5 µM (−) verapamil (ver) and nifedipine (nif). F, Effect of sequential addition of DTx, NKA and HPTx on TEA-verapamil-nifedipine insensitive inactivating K+ currents. G, Effect of sequential addition of SP (0.5 µM) and HPTx (0.05 and 0.2 µM) on DTx-TEA-verapamil-nifedipine insensitive inactivating K+ currents. H, Pulse protocol for the experiments in F and G. I, J, Cumulative block of DTx-, TEA-, verapamil-, nifedipine-insensitive inactivating K+ currents by sequential addition of SP and HPTx (I) or HPTx and NKA (J). K, L, Time course of currents inhibited by HPTx (K), NKA in the presence of HPTx (L), in the same neuron as in K. M, N, Time course of currents inhibited by SP (M) and HPTx in the presence of SP (N), in the same neuron as M. Currents obtained by subtraction of currents before and after addition of drugs and represent currents activated at either +4mV (smallest of the two traces) or +52 mV (largest of the two traces).
Fig. 7
Fig. 7
Effect of drugs on current-voltage relationship of activation and inactivation of pharmacologically isolated K+ currents. Activation curves (A, C, E, G, I, K) and inactivation curves (B, D, F, H, J, L) of inactivating K+ currents recorded in the presence of 60 mM TEA, 5 µM verapamil and nifedipine. Activation curves of LT and HT inactivating currents and inactivation curves of peak currents were obtained as in Fig. 5 and fitted by a sum of two Boltzmann equations, as explained in the Methods section. Data for activation curves of average peak current densities (pA/pF) were normalized as in Fig. 5. A–L. Control curves in the presence of 60 mM TEA, (−) verapamil and nifedipine (5 µM each, A, B), and after addition of DTx (0.5 µM, C, D), in the presence of DTX after addition of HPTx (0.05 µM , E, F or 0.5 µM, G, H) and in the presence of DTX after addition of SP (0.5 µM, G, H; or 5.0 µM, K, L) on the activation (A, C, E, G, I, K) and inactivation (B, D, F, H, J, L). DTx did not inhibit K+ currents (C, circles, n = 10) or change the voltage dependence of inactivation (D). HPTx (E–H, n = 8) inhibited the currents at all voltages in a concentration dependent manner. SP (I–L, n = 5–8) inhibited K+ currents and shifted the voltage dependence of activation at both concentrations and the voltage dependence of inactivation at higher concentrations. Insets between A, B; E, F; C, D; G, H; I, J; and K, L are scaled up overlaps between activation and inactivation curves (window currents) before (line) and after addition of drugs (shaded). Parameters of Boltzmann fits (see Methods) were considered statistically significant if P<0.05; a one-way analysis of variance was first carried out followed by a post-hoc comparisons between the different groups using the Holm-Sidak test.

Similar articles

Cited by

References

    1. Abdulla FA, Stebbing MJ, Smith PA. Effects of substance P on excitability and ionic currents of normal and axotomized rat dorsal root ganglion neurons. Eur. J. Neurosci. 2001;13:545–552. - PubMed
    1. Andersson KE. The overactive bladder: pharmacologic basis of drug treatment. Urol. 1997;50:74–84. - PubMed
    1. Andersson KE. Tachykinins: role in detrusor overactivity? Eur. Urol. 2006;49:423–425. - PubMed
    1. Averbeck B, Izydorczyk I, Kress M. Inflammatory mediators release calcitonin gene-related peptide from dorsal root ganglion neurons of the rat. Neurosci. 2000;98:135–140. - PubMed
    1. Besson JM. The neurobiology of pain. Lancet. 1999;353:1610–1615. - PubMed

Publication types

MeSH terms