

Reticulospinal neurons in the pontomedullary reticular formation of the monkey (Macaca fascicularis)
- PMID: 19631726
- PMCID: PMC2760615
- DOI: 10.1016/j.neuroscience.2009.07.036
Reticulospinal neurons in the pontomedullary reticular formation of the monkey (Macaca fascicularis)
Abstract
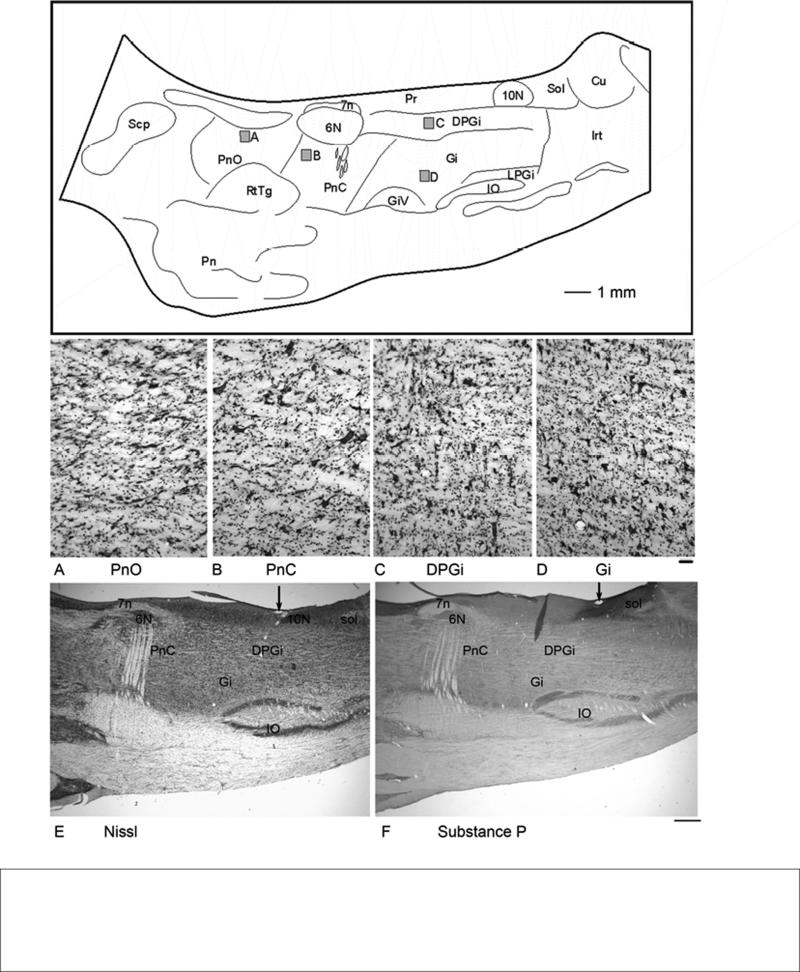
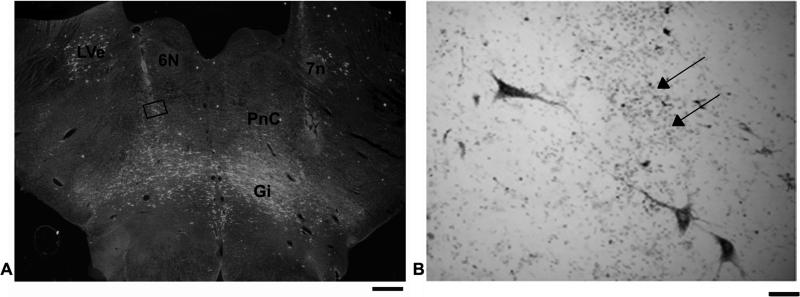
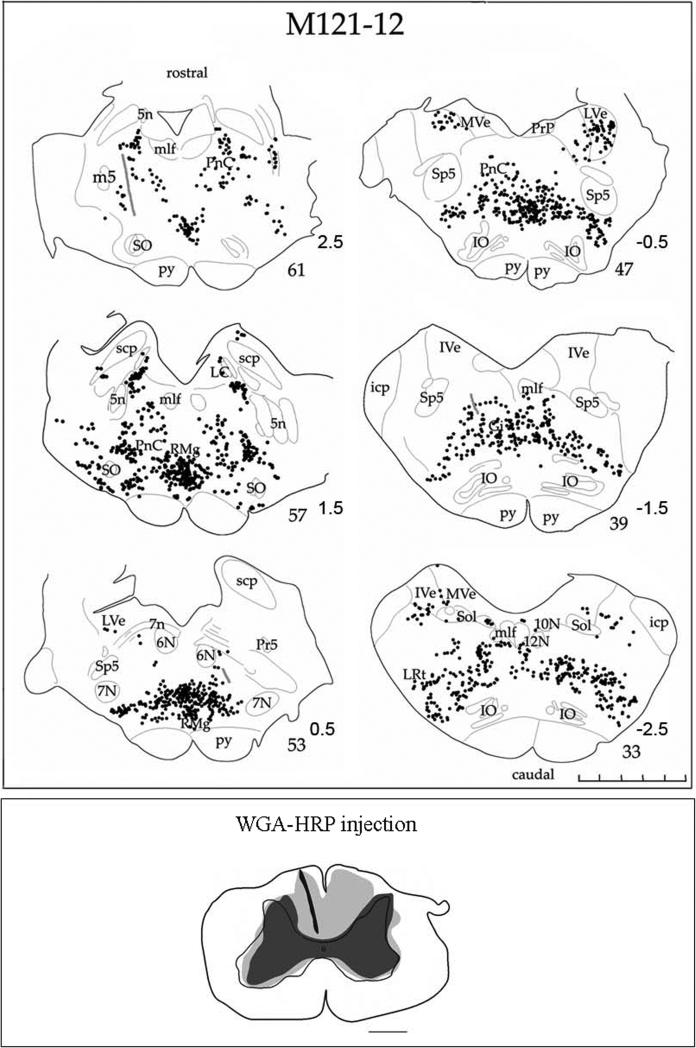
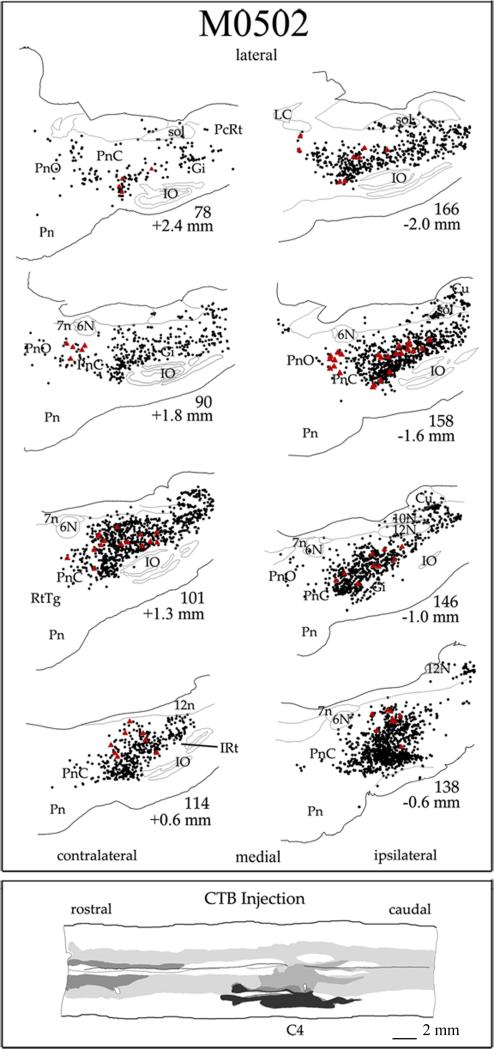
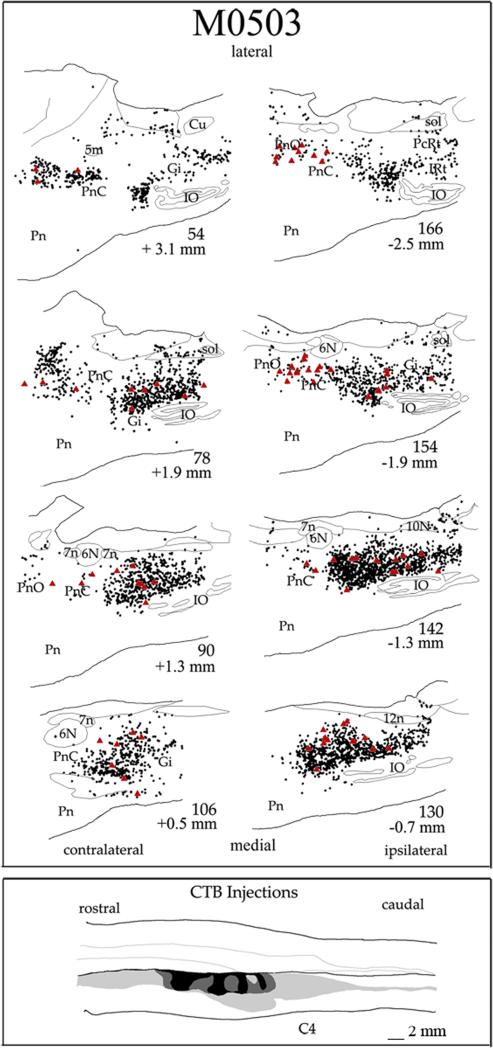
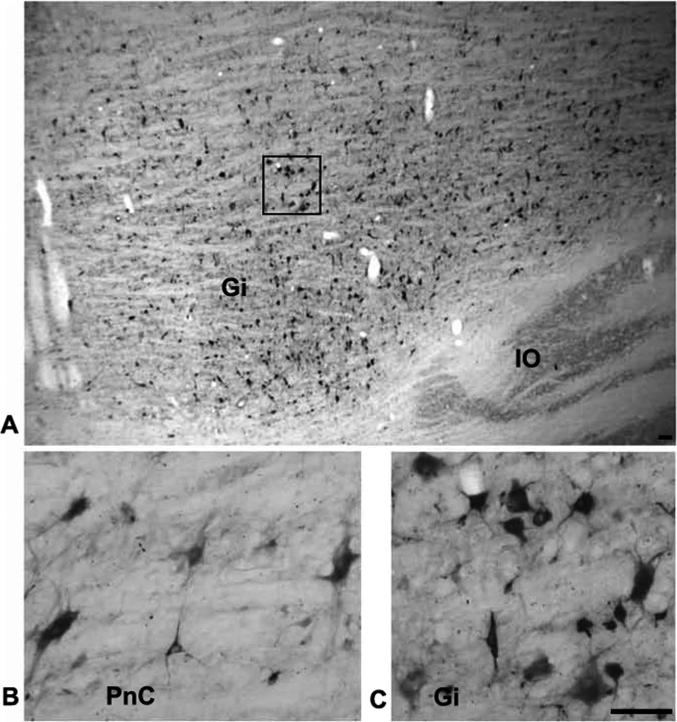
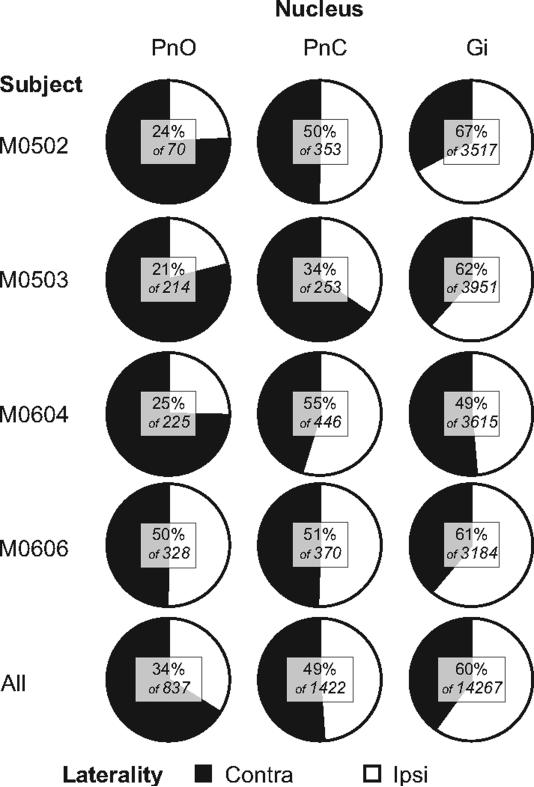
Recent neurophysiological studies indicate a role for reticulospinal neurons of the pontomedullary reticular formation (PMRF) in motor preparation and goal-directed reaching in the monkey. Although the macaque monkey is an important model for such investigations, little is known regarding the organization of the PMRF in the monkey. In the present study, we investigated the distribution of reticulospinal neurons in the macaque. Bilateral injections of wheat germ agglutinin conjugated to horseradish peroxidase (WGA-HRP) were made into the cervical spinal cord. A wide band of retrogradely labeled cells was found in the gigantocellular reticular nucleus (Gi) and labeled cells continued rostrally into the caudal pontine reticular nucleus (PnC) and into the oral pontine reticular nucleus (PnO). Additional retrograde tracing studies following unilateral cervical spinal cord injections of cholera toxin subunit B revealed that there were more ipsilateral (60%) than contralateral (40%) projecting cells in Gi, while an approximately 50:50 ratio contralateral to ipsilateral split was found in PnC and more contralateral projections arose from PnO. Reticulospinal neurons in PMRF ranged widely in size from over 50 microm to under 25 microm across the major somatic axis. Labeled giant cells (soma diameters greater than 50 microm) comprised a small percentage of the neurons and were found in Gi, PnC and PnO. The present results define the origins of the reticulospinal system in the monkey and provide an important foundation for future investigations of the anatomy and physiology of this system in primates.
Figures
Similar articles
-
Subcortical contributions to head movements in macaques. II. Connections of a medial pontomedullary head-movement region.J Neurophysiol. 1994 Dec;72(6):2665-82. doi: 10.1152/jn.1994.72.6.2665. J Neurophysiol. 1994. PMID: 7534824
-
Descending projections from the gigantocellular tegmental field in the cat: cells of origin and their brainstem and spinal cord trajectories.J Comp Neurol. 1988 Feb 22;268(4):546-66. doi: 10.1002/cne.902680406. J Comp Neurol. 1988. PMID: 2451685
-
Cells of origin of the spinoreticular tract in the monkey.J Comp Neurol. 1982 May 1;207(1):61-74. doi: 10.1002/cne.902070106. J Comp Neurol. 1982. PMID: 7096639
-
Distribution of reticulospinal neurons in the chicken by retrograde transport of WGA-HRP.Tissue Cell. 2001 Apr;33(2):141-7. doi: 10.1054/tice.2000.0154. Tissue Cell. 2001. PMID: 11392666
-
Distribution of cholinergic, GABAergic and serotonergic neurons in the medial medullary reticular formation and their projections studied by cytotoxic lesions in the cat.Neuroscience. 1994 Oct;62(4):1155-78. doi: 10.1016/0306-4522(94)90351-4. Neuroscience. 1994. PMID: 7845592 Review.
Cited by
-
Neck rotation modulates flexion synergy torques, indicating an ipsilateral reticulospinal source for impairment in stroke.J Neurophysiol. 2012 Dec;108(11):3096-104. doi: 10.1152/jn.01030.2011. Epub 2012 Sep 5. J Neurophysiol. 2012. PMID: 22956793 Free PMC article.
-
Mesencephalic Locomotor Region and Presynaptic Inhibition during Anticipatory Postural Adjustments in People with Parkinson's Disease.Brain Sci. 2024 Feb 15;14(2):178. doi: 10.3390/brainsci14020178. Brain Sci. 2024. PMID: 38391752 Free PMC article.
-
Separable systems for recovery of finger strength and control after stroke.J Neurophysiol. 2017 Aug 1;118(2):1151-1163. doi: 10.1152/jn.00123.2017. Epub 2017 May 31. J Neurophysiol. 2017. PMID: 28566461 Free PMC article.
-
Reticular formation responses to magnetic brain stimulation of primary motor cortex.J Physiol. 2012 Aug 15;590(16):4045-60. doi: 10.1113/jphysiol.2011.226209. Epub 2012 Jun 6. J Physiol. 2012. PMID: 22674723 Free PMC article.
-
A Novel Wearable Device for Motor Recovery of Hand Function in Chronic Stroke Survivors.Neurorehabil Neural Repair. 2020 Jul;34(7):600-608. doi: 10.1177/1545968320926162. Epub 2020 May 26. Neurorehabil Neural Repair. 2020. PMID: 32452275 Free PMC article. Clinical Trial.
References
-
- Alstermark B, Kummel H. Transneuronal labelling of neurones projecting to forelimb motoneurones in cats performing different movements. Brain Res. 1986;376:387–391. - PubMed
-
- Alstermark B, Pinter M, Sasaki S. Brainstem relay of disynaptic pyramidal EPSPs to neck motoneurons in the cat. Brain Res. 1983;259:147–150. - PubMed
-
- Baker SN, Riddle CN. The macaque reticulospinal tract forms monosynaptic connections with motoneurons in the cervical spinal cord controlling distal arm and hand muscles. Soc.Neurosci.Abstr. 2007;191.3
-
- Beran RL, Martin GF. Reticulospinal fibers of the opossum, Didelphis virginiana. I. Origin. J Comp Neurol. 1971;141:453–465. - PubMed
-
- Berman AL. The brain stem of the cat: a cytoarchitectonic atlas with stereotaxic coordinates. University of Wisconsin Press; Madison, WI: 1968.
Publication types
MeSH terms
Substances
Grants and funding
LinkOut - more resources
Full Text Sources
