

Impact of obesity on oral contraceptive pharmacokinetics and hypothalamic-pituitary-ovarian activity
- PMID: 19631786
- PMCID: PMC2736633
- DOI: 10.1016/j.contraception.2009.04.011
Impact of obesity on oral contraceptive pharmacokinetics and hypothalamic-pituitary-ovarian activity
Abstract
Background: This study was conducted to determine whether increased body mass index (BMI) affects oral contraceptive (OC) pharmacokinetics and suppression of hypothalamic-pituitary-ovarian (HPO) axis activity.
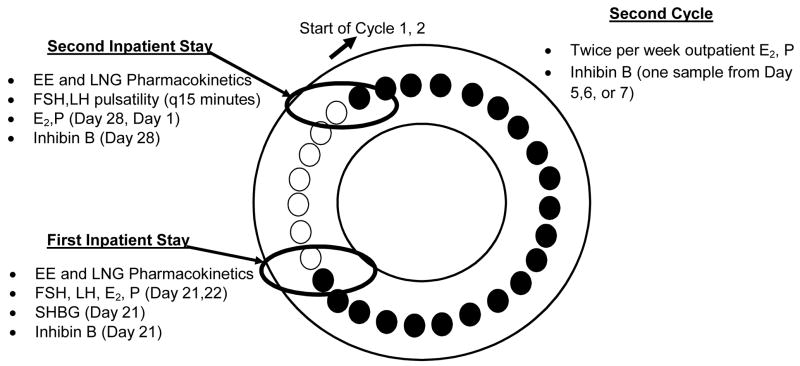
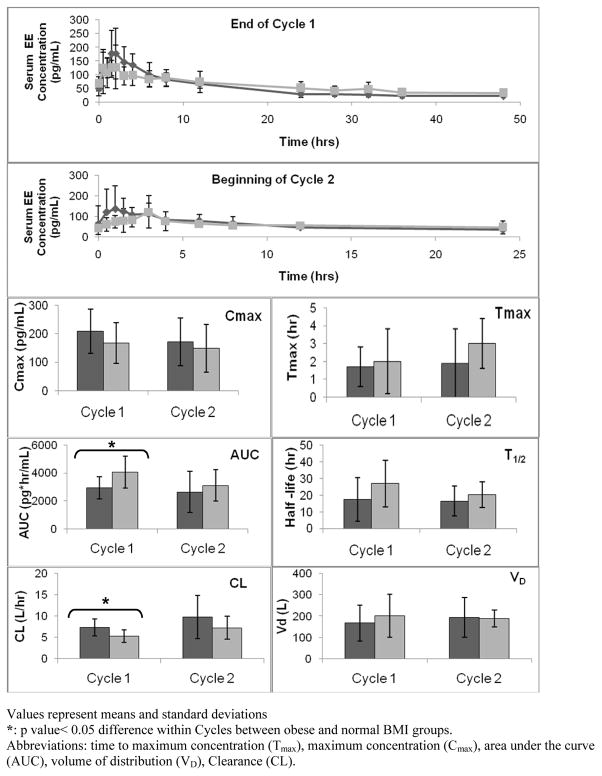
Study design: Ovulatory reproductive-age women with normal weight (BMI <25 kg/m(2); n=10) and with obesity (BMI >30 kg/m(2); n=10) received OCs for two cycles (prospective cohort). Subjects were admitted for two 48-h inpatient stays at the beginning and end of the hormone-free interval. Ethinyl estradiol and levonorgestrel (LNG) levels were evaluated during both inpatient stays. Gonadotropin pulsatility (follicle-stimulating hormone and luteinizing hormone) was measured during the second inpatient stay. Estradiol (E(2)) and progesterone (P) were measured daily during inpatient stays and twice per week in Cycle 2.
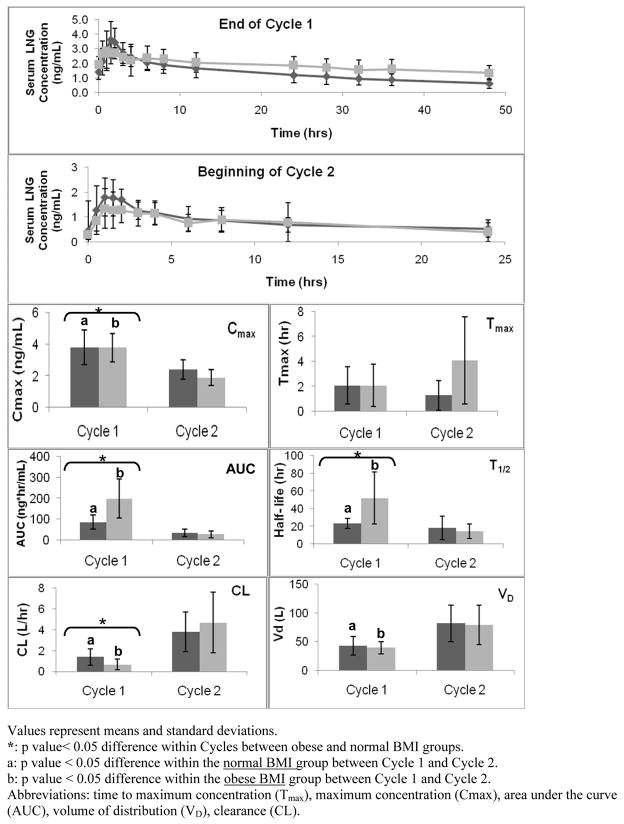
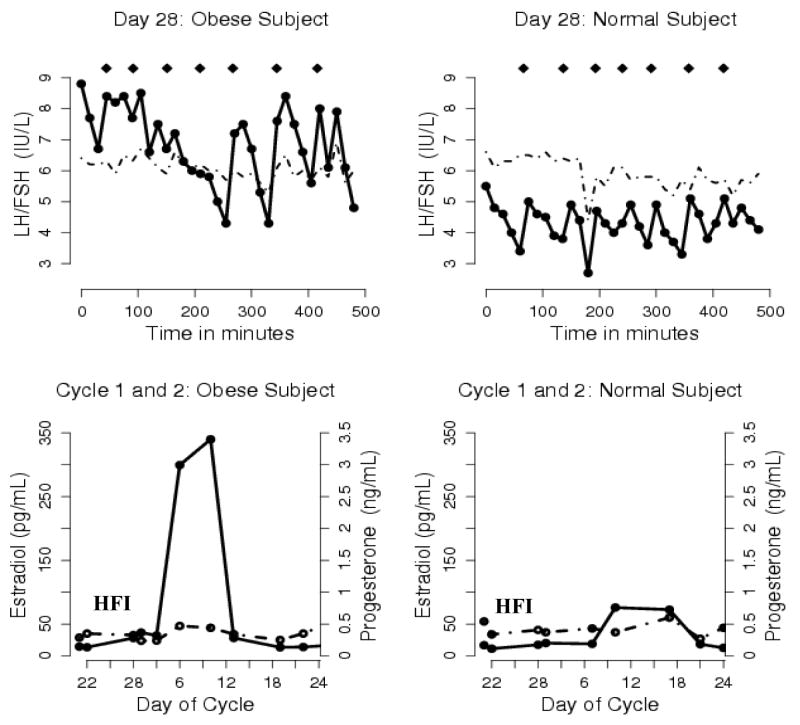
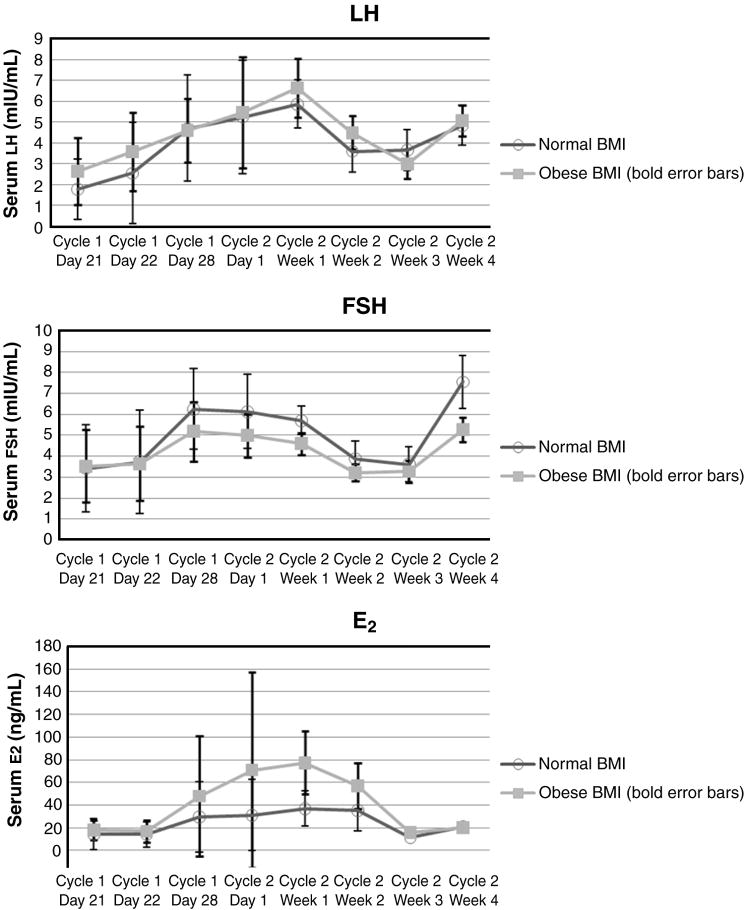
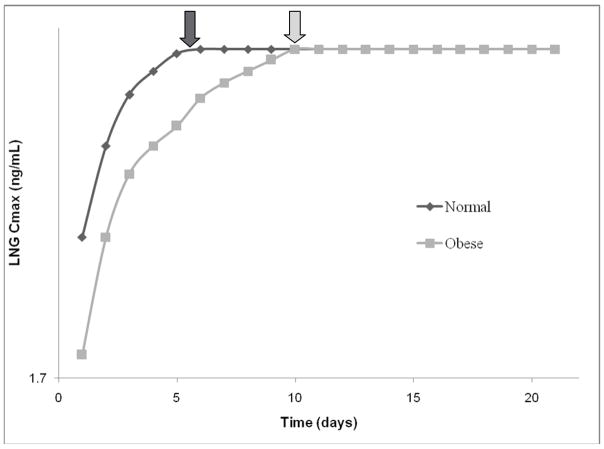
Results: BMI was greater in the obese compared to the normal-BMI group [37.3 kg/m(2) (SD, 6.0) vs. 21.9 kg/m(2) (SD, 1.6); p<.05]. The LNG half-life was significantly longer in the obese group (52.1+/-29.4 vs. 25.6+/-9.3 h, p<.05), which correlated with a lower maximum LNG concentration on Cycle 2, Day 1 [1.9 ng/mL (SD, 0.5) vs. 2.5 ng/mL (SD, 0.7)] and a longer time to reach steady state (10 vs. 5 days) in obese women. There were no significant differences in volume of distribution between groups. LH pulse parameters did not differ statistically between groups but trended toward greater HPO activity in the obese group. Additionally, more obese (6/10 vs. 3/10 normal BMI, p>.05) women exhibited E(2) levels consistent with development of a dominant follicle and P levels consistent with ovulation (2/10 vs. 1/10) during Cycle 2.
Conclusions: Compared to women with normal BMI, obese women exhibit differences in OC pharmacokinetics that are associated with greater HPO activity.
Figures
References
-
- Finer LB, Henshaw SK. Disparities in rates of unintended pregnancy in the United States, 1994 and 2001. Perspect Sex Reprod Health. 2006;38:90–6. - PubMed
-
- Holt VL, Cushing-Haugen KL, Darling JR. Body weight and risk of oral contraceptive failure. Obstet Gynecol. 2002;99:820–7. - PubMed
-
- Hol VL, Scholes D, Wickland KG, Cushing-Haugen KL, Darling JR. Body mass index, weight, and oral contraceptive failure risk. Obstet Gynecol. 2005;105:46–52. - PubMed
-
- Brunner LR, Hogue CJ. The role of body weight in oral contraceptive failure: results from the 1995 National Survey of Family Growth. Ann Epidemiol. 2005;15:492–9. - PubMed
-
- Brunner Huber LR, Toth JL. Obesity and oral contraceptive failure: findings from the 2002 National Survey of Family Growth. Am J of Epidemiol. 2007;166:1306–11. - PubMed
Publication types
MeSH terms
Substances
Grants and funding
LinkOut - more resources
Full Text Sources
Other Literature Sources
Medical
