

Association of lipid levels during gestation with preeclampsia and gestational diabetes mellitus: a population-based study
- PMID: 19631920
- PMCID: PMC5483324
- DOI: 10.1016/j.ajog.2009.05.032
Association of lipid levels during gestation with preeclampsia and gestational diabetes mellitus: a population-based study
Abstract
Objective: The study evaluates lipids profile changes during gestation in pregnancies with and without preeclampsia and/or gestational diabetes.
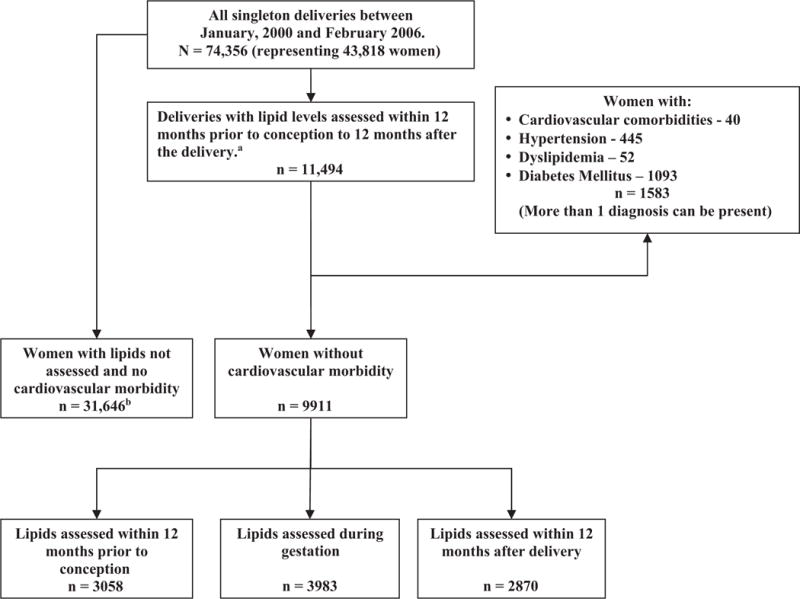
Study design: Lipid profiles were assessed between year prior and after pregnancy in 9911 women without cardiovascular comorbidities.
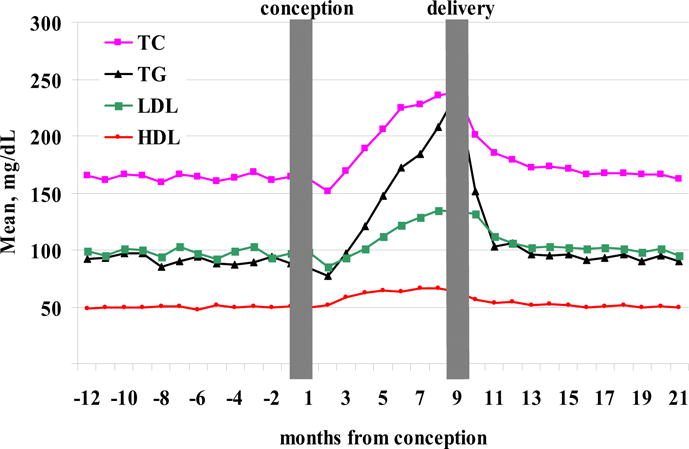
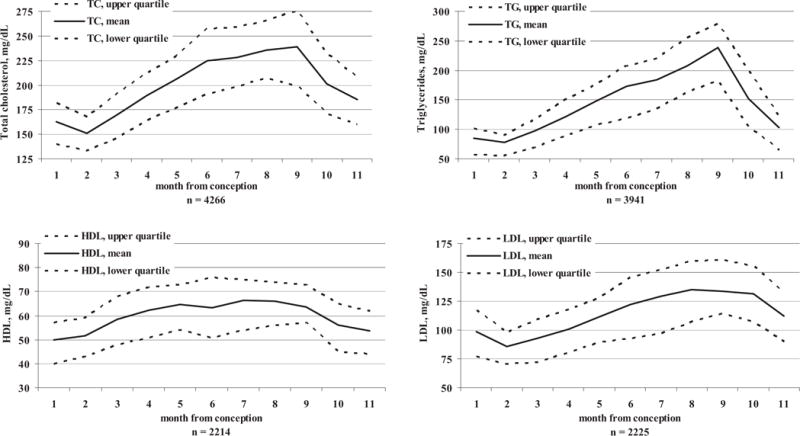
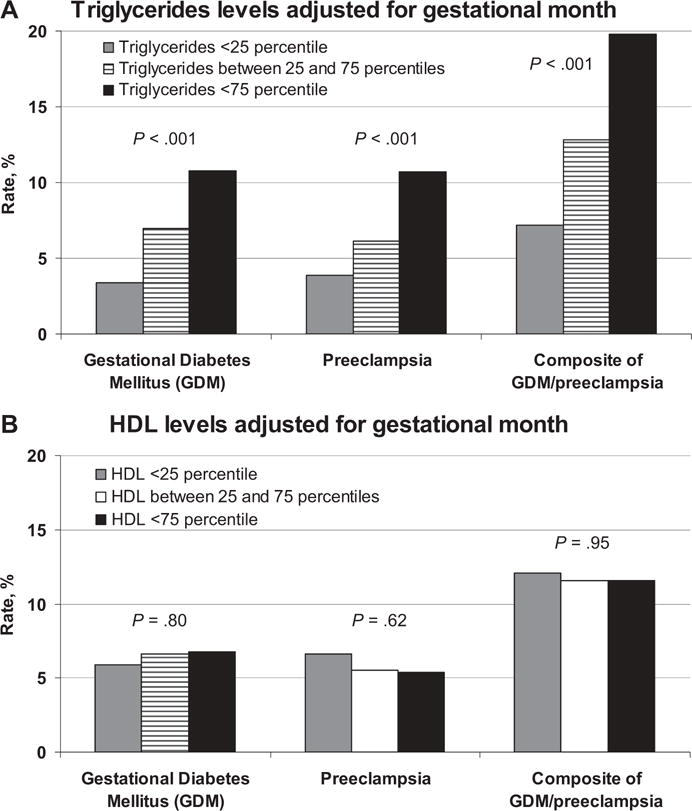
Results: Lipid levels during gestation varied substantially with a nadir following conception and a peak at delivery. Compared to preconception levels total cholesterol levels increased from 164.4 mg/dL to 238.6 mg/dL and triglycerides (TGs) from 92.6 mg/dL to 238.4 mg/dL. The composite endpoint (gestational diabetes mellitus or preeclampsia) occurred in 1209 women (12.2%). Its prevalence increased with levels of TG-from 7.2% in the group with low TGs (<25th percentile adjusted for the gestational month) to 19.8% in the group with high TGs (>75th percentile), but was not associated with high-density lipoprotein levels. In multivariate analysis higher TGs levels, but not low high-density lipoprotein, were associated with the primary endpoint.
Conclusion: Lipid levels change substantially during gestation. Abnormal levels of TGs are associated with pregnancy complications.
Figures
References
-
- Kaaja RJ, Greer IA. Manifestations of chronic disease during pregnancy. JAMA. 2005;294:2751–7. - PubMed
-
- Hollander MH, Paarlberg KM, Huisjes AJ. Gestational diabetes: a review of the current literature and guidelines. Obstet Gynecol Surv. 2007;62:125–36. - PubMed
-
- Frishman WH, Veresh M, Schlocker SJ, Tejani N. Pathophysiology and medical management of systemic hypertension in preeclampsia. Curr Hypertens Rep. 2006;8:502–11. - PubMed
MeSH terms
Substances
Grants and funding
LinkOut - more resources
Full Text Sources
Medical
Miscellaneous
