. 2009 Jul 23;138(2):245-56.
doi: 10.1016/j.cell.2009.04.056.

Androgen receptor regulates a distinct transcription program in androgen-independent prostate cancer

Affiliations

Androgen receptor regulates a distinct transcription program in androgen-independent prostate cancer

Qianben Wang et al. Cell. .

Abstract

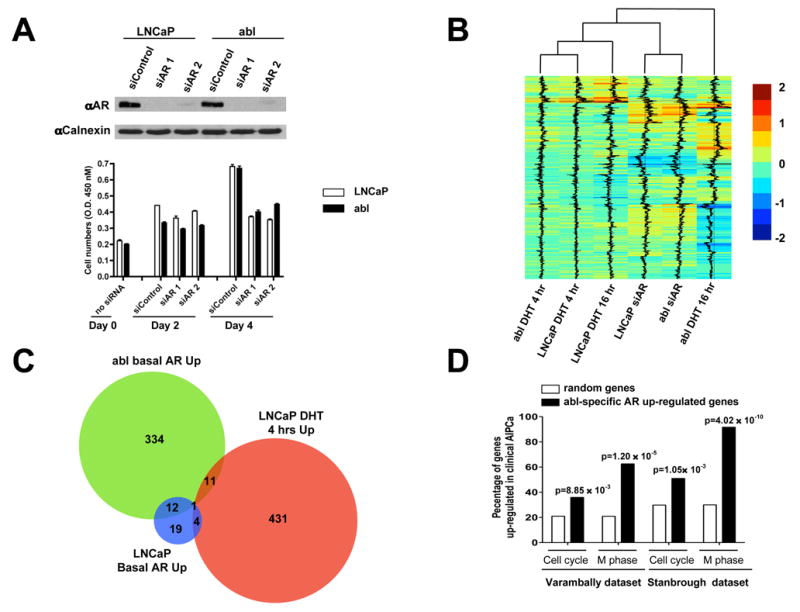
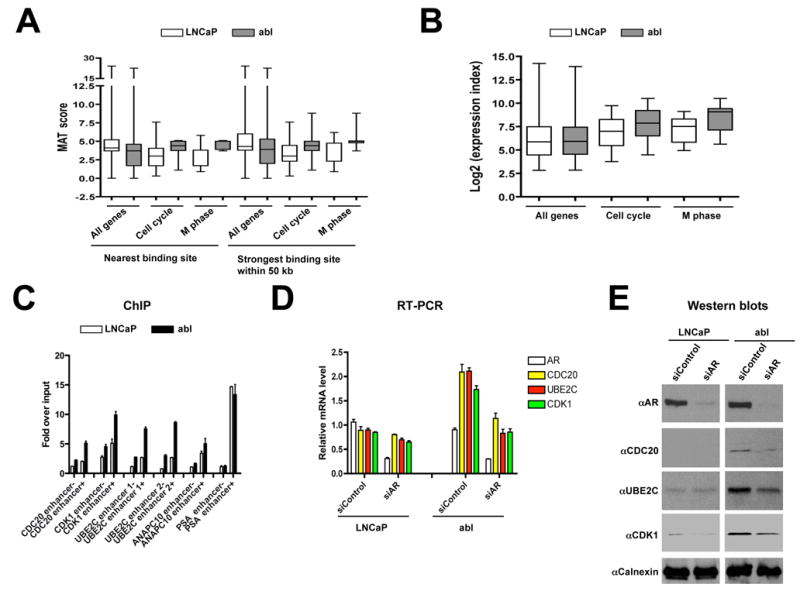
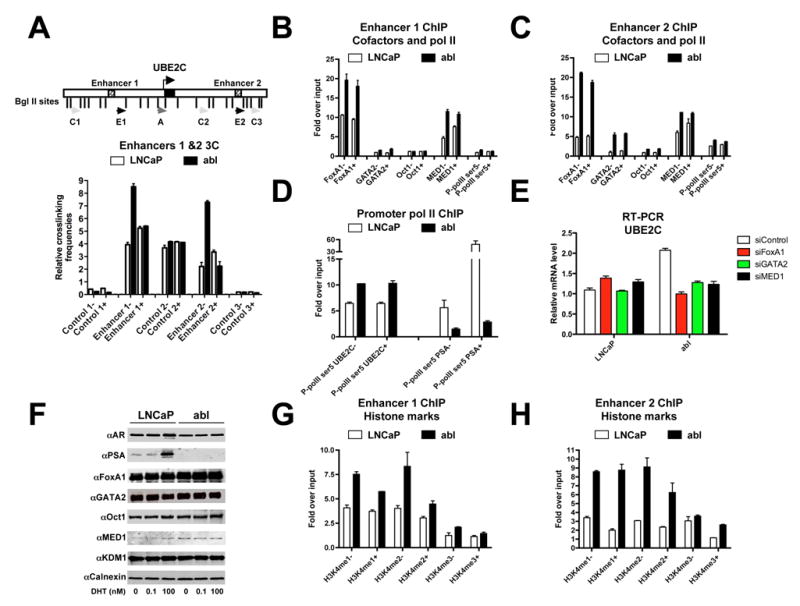
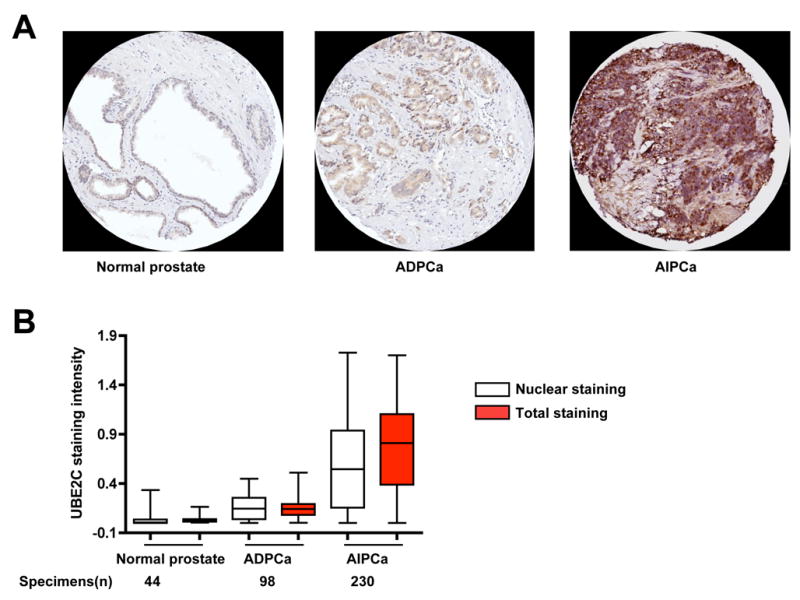
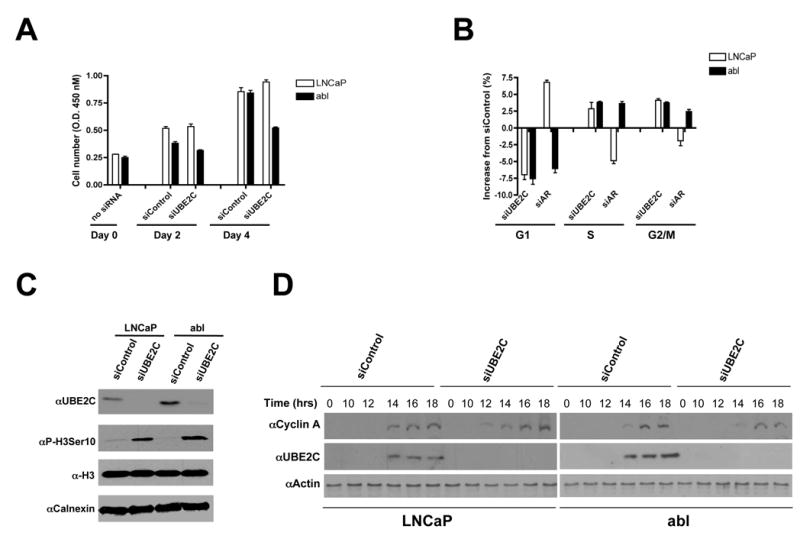
The evolution of prostate cancer from an androgen-dependent state to one that is androgen-independent marks its lethal progression. The androgen receptor (AR) is essential in both, though its function in androgen-independent cancers is poorly understood. We have defined the direct AR-dependent target genes in both androgen-dependent and -independent cancer cells by generating AR-dependent gene expression profiles and AR cistromes. In contrast to what is found in androgen-dependent cells, AR selectively upregulates M-phase cell-cycle genes in androgen-independent cells, including UBE2C, a gene that inactivates the M-phase checkpoint. We find that epigenetic marks at the UBE2C enhancer, notably histone H3K4 methylation and FoxA1 transcription factor binding, are present in androgen-independent cells and direct AR-enhancer binding and UBE2C activation. Thus, the role of AR in androgen-independent cancer cells is not to direct the androgen-dependent gene expression program without androgen, but rather to execute a distinct program resulting in androgen-independent growth.


Figures

Figure 1
Figure 1. AR silencing in abl cells significantly decreases M phase cell cycle gene expression
(A) AR silencing decreases both LNCaP and abl cell proliferation. LNCaP cells were cultured regular RPMI 1640 supplemented with 10% fetal bovine serum (FBS). abl cells were grown in phenol-red free RPMI 1640 supplemented with 10% charcoal/dextran-stripped FBS. Both cell lines were grown in the absence of supplemental DHT. Cells were transfected with two independent AR siRNA. The cell proliferation was measured on day 2 and day 4 after siRNA transfection using the WST-1 assay (mean (n=3)±s.e.). (B) Cluster analysis of genes differentially expressed (q<0.05) by either DHT treatment and/or siAR transfection. Unsupervised hierarchical clustering of genes (rows) from cells in different conditions (columns) was performed. Brown and blue color represents up-regulation and down-regulation, respectively. (C) A Venn diagram showing the basal AR up-regulated genes in LNCaP and abl cells and DHT 4 hr up-regulated genes in LNCaP cells. (D) Comparison of abl-specific AR up-regulated genes with up-regulated genes in two clinical AIPCa datasets (Stanbrough et al., 2006; Varambally et al., 2005).
Figure 2
Figure 2. AR directly regulates basal and activated AR up-regulated genes in LNCaP and abl cells
(A) Comparison of AR whole genome binding in LNCaP and abl cells. Triplicate AR whole genome ChIP-on-chip was performed in LNCaP and abl cells treated with DHT for 4 hr. MAT was used to detect AR ChIP-enriched regions. Each dot represents a binding site. Red dots represents differential binding while dark dots refers to non-differential binding. (B) Correlation of AR binding to differential gene expression in LNCaP and abl cells. The graph represents the percentage of genes having AR binding sites with 20 kb of the transcription start sites. The enrichment of AR binding near the TSS of up-regulated genes over whole genome background is statistically significant in both LNCaP and abl cells (Chi-squared test, LNCaP (siControl/siAR, p=1.82 × 10⁻³; DHT 4 hrs/vehicle, p=2.58 × 10−71; DHT 16 hrs/vehicle, p=9.57 × 10−65), abl (siControl/siAR, p=6.90 × 10⁻⁸; DHT 4 hrs/vehicle, p=7.91× 10−46; DHT 16 hrs/vehicle, p=2.06 × 10⁻²⁷).
Figure 3
Figure 3. Higher occupancy of AR binding near the M-phase cell cycle genes leads to higher expression levels of these genes in abl cells
(A) Comparison of MAT score of the nearest and the strongest AR binding site within 50 kb of all genes, basal AR up-regulated cell cycle genes and M phase genes in LNCaP and abl cells. The difference of all genes and M-phase genes between two cell lines is statistically significant (t-test on two independent samples, means+s.e., nearest binding site (all genes, abl/LNCaP=0.78-fold, p=2.17 × 10−154, M-phase genes, abl/LNCaP= 1.75-fold, p=5.85 × 10⁻⁴), strongest binding site (all genes, abl/LNCaP=0.8-fold, p=2.48× 10−127, M-phase genes, abl/LNCaP= 1.64-fold, p=6.29 × 10⁻³). (B) Comparison of gene expression index of all genes, basal AR up-regulated cell cycle and M-phase genes in abl cells. Significant difference is observed between cell cycle and M-phase gene expression in two cell lines (t-test on two independent samples, means+s.e., cell cycle, 1.13-fold, p=4.51 × 10⁻³, M-phase 1.18-fold, p=2.65 × 10⁻³). (C) ChIP analysis of AR recruitment to various AR binding sites near cell cycle genes. The PSA enhancer was used as a positive control. ChIP assays were performed with anti-AR antibodies in the presence (+) and absence (−) of DHT. (mean (n=2)±s.e.). (D) AR silencing specifically decrease high expression of M phase genes CDC20, UBE2C and CDK1 in abl cells. Seventy-two hours after siRNA transfection into LNCaP and abl cells in the absence of DHT, total RNA was isolated and amplified by real-time RT-PCR using gene specific primers (mean (n=3) ±s.e.). (E) AR silencing specifically decreases high protein expression levels of CDC20, UBE2C and CDK1 in abl cells. Western blots were performed using the antibodies indicated ninety-six hours after siRNA transfection into LNCaP and abl cells without DHT.
Figure 4
Figure 4. Higher levels of active epigenetic histone marks and recruitment of collaborating factors are correlated with greater AR occupancy on the UBE2C enhancers in abl cells
(A) Upper panel: Schematic diagram showing the UBE2C locus. The arrows indicate the location and the direction of primers used in the 3C-qPCR assays. The anchor primer [A] and the Taqman probe were designed in the Bgl II fragment containing the UBE2C promoter. All other test primers [C1, C2, C3, E1, and E2] were designed within 50 bp to the restriction sites. Lower panel: The two UBE2C enhancers interact with the UBE2C promoter in abl cells. 3C assays were performed using Bgl II enzyme in LNCaP and abl cells in the presence (+) and absence (−) of DHT (mean (n=2) ±s.e.). (B and C) Stronger FoxA1 and MED1 binding to the UBE2C enhancer 1 and FoxA1, GATA2 and MED1 binding to the UBE2C enhancer 2 in abl cells than in LNCaP cells. ChIP assays were performed using antibodies against FoxA1, GATA2, Oct1, MED1 and P-pol II ser 5 in LNCaP and abl cells treated with (+) and without (−) androgen (mean (n=2) ±s.e.). (D) Higher p-pol II ser 5 occupancy on the UBE2C promoter in abl cells than in LNCaP cells. P-pol II ser 5 binding at the PSA promoter was served as a control. ChIP assays were conducted in LNCaP and abl cells in the presence (+) and absence (−) of DHT using an anti-p-pol II ser 5 antibody. (E) Effects of siRNA on UBE2C gene expression in LNCaP and abl cells. Real-time PCR was performed seventy-two hours after siRNA transfection in the absence of DHT (mean (n=3) ±s.e.). (F) Comparison of protein expression in LNCaP and abl cells by Western blots. Western blots analyses were performed comparing AR, PSA, FoxA1, GATA2, Oct1, MED1 and KDM1 protein expression levels in the absence and presence of DHT (0.1 nM and 100 nM). (G and H) UBE2C enhancers 1 (G) and 2 (H) have higher H3K4me1 and H3K4me2 levels in abl cells than in LNCaP cells. Levels of H3K4 me1, H3K4me2 and H3K4me3 on UBE2C enhancers were determined by ChIP assays in the presence (+) and absence (−) of DHT using specific antibodies against H3K4 me1, H3K4me2 and H3K4me3 (mean (n=2) ±s.e.).
Figure 5
Figure 5. H3K4me2 and FoxA1 act upstream of AR and are required for differential AR binding in abl cells
(A) Over-expression of KDM1 abolishes differential AR binding in LNCaP and abl cells. Cells were transfected with a FLAG-tagged KDM1 vector or an empty vector control. Three days after transfection, cells were treated with (+) or without (−) DHT. AR ChIP was then performed on the UBE2C enhancers. The over-expression of KDM1 levels was monitored by Western blot. (B) FoxA1 silencing abolishes differential AR binding in LNCaP and abl cells. Cells were transfected with siFoxA1. AR ChIP was then performed in the presence (+) and absence (−) of DHT on the UBE2C enhancers. The reduction of FoxA1 protein level was verified by Western blot. (C) AR silencing has no effect on differential H3K4me2 level and FoxA1 recruitment. Cells were transfected with siAR. H3K4me2 and FoxA1 ChIP were then performed in the presence (+) and absence (−) of DHT on the UBE2C enhancers. The reduction of AR protein was demonstrated by Western blot. D) A hierarchical model for AR action on the UBE2C enhancers. H3K4 methylation and FoxA1 act upstream of AR, and H3K4 methylation functions upstream of FoxA1.
Figure 6
Figure 6. UBE2C protein expression level is over-expressed in AIPCa cases
(A) Representative tissue microarray elements stained with an antibody against UBE2C (magnification 20 ×). Stronger staining of UBE2C was seen in AIPCa than in ADPCa. (B) Analysis of UBE2C protein expression in normal prostate, ADPCa and AIPCa. Tissue microarrays were scanned and scored using the Ariol image analysis system. Nuclear staining and total staining reflect a combination of the percentage of positive nuclei and the intensity of the stain, and a combination of the positive area score and the intensity of the stain, respectively. AIPCa has stronger nuclear staining and total staining\\than ADPCa (Welch one-side t-test, p< 2.2 × 10⁻¹⁶ for both staining scores). ADPCa has higher nuclear staining and total staining scores compared with normal prostate (p=5.80 × 10⁻¹³, p< 2.2 × 10⁻¹⁶, respectively).
Figure 7
Figure 7. UBE2C silencing selectively decreases abl cell growth
(A) Silencing of UBE2C selectively decreases abl cell proliferation. LNCaP and abl were plated as described in Figure 1.The cell proliferation was measured on day 2 and day 4 after siRNA transfection using the WST-1 assay (mean (n=3)±s.e.). (B) Silencing of UBE2C increases G2/M and S phase cells in LNCaP and abl cells. Ninety-six hr after siRNAs transfection in the absence of DHT, cells were analyzed by FACS (mean (n=2)±s.e.). (C) Silencing of UBE2C leads to a prolonged mitosis as indicated by P-H3Ser10. Ninety-six hr post siRNAs transfection in the absence of DHT, Western blots were performed with histone extraction (for P-H3Ser10 and total H3) or whole cell lysate (for UBE2C and calnexin) using the antibodies indicated. (D) UBE2C silencing results in a shortened G1 in LNCaP cells but not in abl cells. LNCaP and abl cells were transfected with siControl or siUBE2C in the absence of DHT. After 6–8 hr, cells were synchronized in G0 by serum starvation for 24 hr. Cells were stimulated to re-enter cell cycle by the addition of 20% serum and harvested at the indicated time points. Cell lysates were subjected to Western blot with the indicated antibodies.

References

    1. Barski A, Cuddapah S, Cui K, Roh TY, Schones DE, Wang Z, Wei G, Chepelev I, Zhao K. High-resolution profiling of histone methylations in the human genome. Cell. 2007;129:823–837. - PubMed
    1. Bernstein BE, Kamal M, Lindblad-Toh K, Bekiranov S, Bailey DK, Huebert DJ, McMahon S, Karlsson EK, Kulbokas EJ, 3rd, Gingeras TR, et al. Genomic maps and comparative analysis of histone modifications in human and mouse. Cell . 2005;120:169–181. - PubMed
    1. Carroll JS, Liu XS, Brodsky AS, Li W, Meyer CA, Szary AJ, Eeckhoute J, Shao W, Hestermann EV, Geistlinger TR, et al. Chromosome-wide mapping of estrogen receptor binding reveals long-range regulation requiring the forkhead protein FoxA1. Cell. 2005;122:33–43. - PubMed
    1. Chen CD, Welsbie DS, Tran C, Baek SH, Chen R, Vessella R, Rosenfeld MG, Sawyers CL. Molecular determinants of resistance to antiandrogen therapy. Nat Med. 2004;10:33–39. - PubMed
    1. Comstock CE, Knudsen KE. The complex role of AR signaling after cytotoxic insult: implications for cell-cycle-based chemotherapeutics. Cell Cycle. 2007;6:1307–1313. - PubMed

Publication types