. 2009 Oct 9;284(41):28058-28068.
doi: 10.1074/jbc.M109.034231. Epub 2009 Jul 24.

Interactions between calmodulin, adenosine A2A, and dopamine D2 receptors

Affiliations

Interactions between calmodulin, adenosine A2A, and dopamine D2 receptors

Gemma Navarro et al. J Biol Chem. .

Abstract

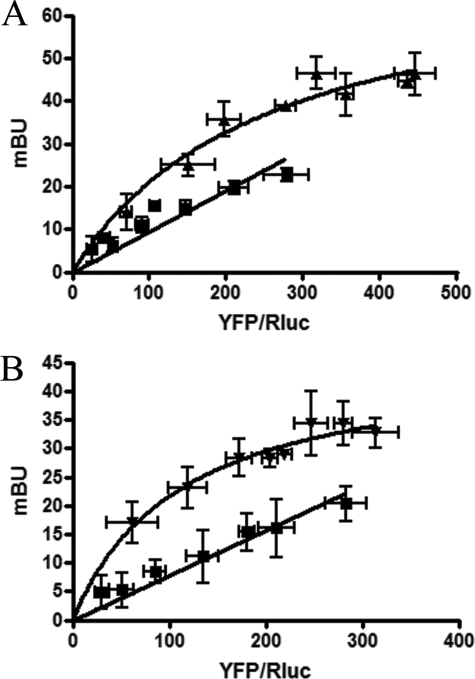
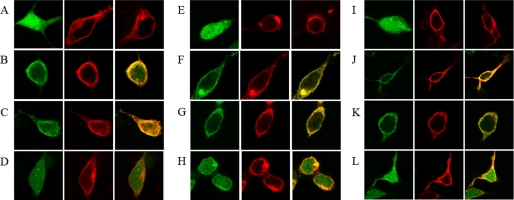
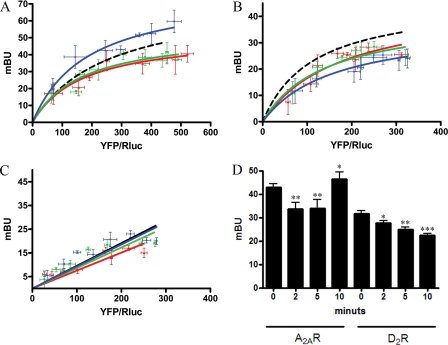
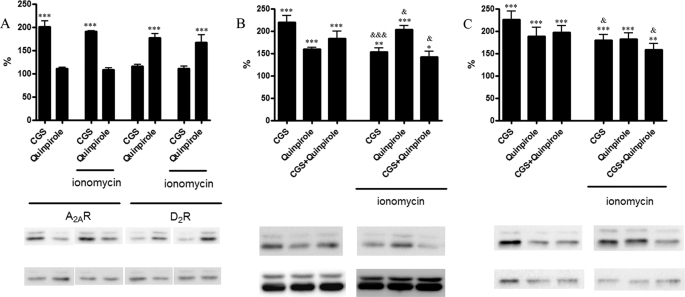
The Ca(2+)-binding protein calmodulin (CaM) has been shown to bind directly to cytoplasmic domains of some G protein-coupled receptors, including the dopamine D(2) receptor. CaM binds to the N-terminal portion of the long third intracellular loop of the D(2) receptor, within an Arg-rich epitope that is also involved in the binding to G(i/o) proteins and to the adenosine A(2A) receptor, with the formation of A(2A)-D(2) receptor heteromers. In the present work, by using proteomics and bioluminescence resonance energy transfer (BRET) techniques, we provide evidence for the binding of CaM to the A(2A) receptor. By using BRET and sequential resonance energy transfer techniques, evidence was obtained for CaM-A(2A)-D(2) receptor oligomerization. BRET competition experiments indicated that, in the A(2A)-D(2) receptor heteromer, CaM binds preferentially to a proximal C terminus epitope of the A(2A) receptor. Furthermore, Ca(2+) was found to induce conformational changes in the CaM-A(2A)-D(2) receptor oligomer and to selectively modulate A(2A) and D(2) receptor-mediated MAPK signaling in the A(2A)-D(2) receptor heteromer. These results may have implications for basal ganglia disorders, since A(2A)-D(2) receptor heteromers are being considered as a target for anti-parkinsonian agents.


Figures

FIGURE 1.
FIGURE 1.
Identification of CaM-A2A and CaM-D2 receptor oligomers by BRET experiments. BRET saturation curves were performed using HEK-293 cells co-expressing A2ARRluc and CaMYFP (triangles) (A) or D2RRluc and CaMYFP (inverted triangles) (B) or A1RRluc and CaMYFP (squares). Co-transfections were performed with increasing amounts of plasmid-YFP (0.1–1 μg of cDNA), whereas the plasmid-Rluc construct was maintained constant (0.6 μg of cDNA for A2ARRluc, 1 μg of cDNA for D2RRluc, and 0.7 μg of cDNA for A1RRluc). Both fluorescence and luminescence for each sample were measured before every experiment to confirm similar donor expressions (about 100,000 luminescent units) while monitoring the increase in acceptor expression. The relative amount of acceptor is given as the ratio between the fluorescence of the acceptor (YFP) and the luciferase activity of the donor (Rluc). BRET data are expressed as means ± S.D. of 4–8 different experiments grouped as a function of the amount of BRET acceptor.
FIGURE 2.
FIGURE 2.
Identification of the A2A receptor CaM binding site. A, BRET competition experiments were performed with HEK-293 cells transfected with A2ARRluc (0.6 μg of cDNA), CaMYFP (0.6 μg of cDNA), and increasing amounts of cDNA corresponding to A2AR (white bars) or A2ARAAA (R291IREFR296QTFR300 mutated to A291IREFA296QTFA300; black bars). Both fluorescence and luminescence for each sample were checked to confirm similar donor and acceptor expression (about 100,000 luminescent units and 10,000 fluorescence units). A2AR and A2ARAAA receptor expression was monitored by Western blot (not shown). B, BRET saturation curves were performed with HEK-293 cells co-expressing A2ARAAARluc (0.6 μg of cDNA) and increasing amounts of CaMYFP (0.1–1 μg of cDNA) and untreated (white symbols) or treated (10 min; black symbols) with 1 μm ionomycin in HBSS buffer containing 1.26 mm CaCl2. Both fluorescence and luminescence of each sample were checked to confirm similar donor expressions (about 100,000 luminescent units) while monitoring the increase in acceptor expression. The relative amount of acceptor is given as the ratio between the fluorescence of the acceptor (YFP) and the luciferase activity of the donor (Rluc). BRET data are expressed as means ± S.D. of 4–6 different experiments grouped as a function of the amount of BRET acceptor. Results are compared with the curve obtained for A2ARRluc and CaMYFP (dotted line; see Fig. 1A).
FIGURE 3.
FIGURE 3.
Membrane colocalization of CaM with A2A or D2 receptors. Co-transfected HEK-293 cells were washed and resuspended for 2.5 h in HBSS buffer containing 1.26 mm CaCl2 (A–D and I–L) or in a Ca+2-free HBSS buffer containing 1 mm EDTA (E–H). A, E, and I, confocal microscopy images of HEK-293T cells expressing (from left to right in each panel) CaMYFP (0.6 μg of cDNA), A2ARRluc (1 μg of cDNA), or D2RRluc (1 μg of cDNA). B–D, F–H, and J–L, confocal microscopy images of HEK-293T cells co-transfected with the above described amounts of cDNA for CaMYFP and A2ARRluc (B, F, and J), CaMYFP and D2RRluc (C, G, and K), or CaMYFP and A1RRluc (1 μg of cDNA) (D, H, and L). Ionomycin-treated cells (10 min prior to fixation) are shown in I–L. CaM was identified by YFP fluorescence (green images), and receptor-Rluc constructs were identified by immunocytochemistry (using a monoclonal anti-Rluc primary antibody and a cyanine-3-conjugated secondary antibody). Colocalization (yellow) is shown in the right panels.
FIGURE 4.
FIGURE 4.
Effect of intracellular Ca2+ on the interaction between CaM and A2A or D2 receptors detected by BRET experiments. A–C, BRET saturation curves were performed using HEK-293 cells co-expressing A2ARRluc and CaMYFP (A), D2RRluc and CaMYFP (B), or A1RRluc and CaMYFP as negative control (C) (see the legend to Fig. 1). In all cases, cells were treated with HBSS buffer containing 1.26 mm CaCl2 and 1 μm ionomycin at 10 (blue), 5 (green), or 2 (red) min before BRET determination. BRET saturation curves were compared with the one obtained in the absence of ionomycin (dotted line; see Fig. 1). The relative amount of acceptor is given as the ratio between the fluorescence of the acceptor (YFP) and the luciferase activity of the donor (Rluc). BRET data are expressed as means ± S.D. of 4–8 different experiments grouped as a function of the amount of BRET acceptor. D, HEK-293 cells were transfected with 0.6 μg of cDNA for A2ARRluc (A2AR) or 1 μg of cDNA for D2RRluc (D2R) and 1 μg of cDNA of CaMYFP, and membranes were obtained 48 h after transfection. Membranes were resuspended in free Ca2+ HBSS buffer, and 1.26 mm CaCl2 was added for the indicated times before BRET determination. BRET data are expressed as means ± S.E. of five different experiments. Significant differences over ionomycin-non-treated cells were calculated by one-way analysis of variance and Bonferroni test (*, p < 0.05; **, p < 0.01; ***, p < 0.005).
FIGURE 5.
FIGURE 5.
CaM interaction with A2A-D2 receptor heteromers detected by BRET competition experiments. BRET competition experiments were performed with HEK-293 cells expressing donor and acceptor constructs to give submaximal BRET values. A, cells were co-transfected with the cDNA corresponding to A2ARRluc (0.6 μg) and CaMYFP (0.4 μg) and increasing amounts of D2R cDNA as competitor (0.3–2.5 μg), whose expression was monitored by Western blotting (bottom) mBU, milli-BRET units. B, cells were cotransfected with the cDNA corresponding to A2ARRluc (0.6 μg) and D2LRYFP (1.5 μg) and increasing amounts of cDNA of CaMGFP2 as competitor (0.2–1.5 μg), whose expression was monitored by measuring the GFP2 fluorescence (1,000–20,000 fluorescence units), as described under “Experimental Procedures.” To determine the YFP fluorescence in BRET experiments, the spectral signature was considered to control the GFP2 contribution to the detection channel (28, 29). Cells were cotransfected with the cDNA corresponding to D2LRRluc (1 μg; C) or D2SRRluc (0.8 μg; D) and CaMYFP (0.4 μg) and increasing amounts of cDNA of A2AR as competitor (black bars) or A1R as negative control (white bars), whose expression was monitored by dot blotting (results not shown). At the top of each panel, a scheme depicts the expressed proteins in BRET competition assays.
FIGURE 6.
FIGURE 6.
SRET for CaM, A2A receptor and D2 receptor in living cells. SRET saturation curves were performed in HEK-293 cells expressing A2AR-Rluc (0.75 μg of cDNA), CaMGFP2 (0.6 μg of cDNA), and increasing amounts of D2RYFP (0.5–5 μg of the cDNA). Net SRET was obtained by monitoring the YFP fluorescence emission after coelenterazine H addition, with subtraction of the value obtained with cells expressing the same amount of A2AR-Rluc and CaMGFP2. Significant net SRET was detected for A2ARRluc-CaMGFP2-D2RYFP coupling, whereas negligible or linear net SRET was obtained in cells expressing equivalent amounts (equivalent fluorescence and luminescence units) of A2ARRluc, CaMGFP2, and 5HT2BYFP or A1RRluc, CaMGFP2, and D2RYFP, which were used as negative controls. Values, expressed as net SRET, represent means ± S.E. of five independent experiments performed in triplicate. At the top, a scheme depicts the expressed proteins in SRET assays.
FIGURE 7.
FIGURE 7.
Effect of intracellular Ca2+ on the molecular interactions between CaM, A2A, and D2 receptors. A, effect of Ca2+ levels on the A2A-D2 receptor heteromerization detected by BRET. BRET saturation curves were performed with HEK-293 cells co-expressing A2ARRluc (0.6 μg of cDNA) and increasing amounts of D2RYFP (0.3–4 μg of cDNA). Cells in HBSS buffer containing 1.26 mm CaCl2 were untreated (black) or treated with 1 μm ionomycin for 2 (red), 5 (green) or 10 (blue) min before BRET determination. Both fluorescence and luminescence for each sample were measured to confirm similar donor expressions (about 100,000 luminescent units) while monitoring the increase acceptor expression (1,000–15,000 fluorescent units). The relative amount of acceptor is given as the ratio between the fluorescence of the acceptor (YFP) and the luciferase activity of the donor (Rluc). BRET data are expressed as means ± S.D. of four different experiments grouped as a function of the amount of BRET acceptor. mBU, milli-BRET units. B, effect of Ca2+ levels on the CaM-A2A-D2 receptor oligomerization detected by SRET. SRET saturation curves were performed in HEK-293 cells expressing A2ARRluc, CaMGFP2, and increasing amounts of D2RYFP, as described in the legend to Fig. 6. Cells in HBSS buffer containing 1.26 mm CaCl2 were treated with 1 μm ionomycin for 10 min before SRET determination as described in the legend to Fig. 6, and the SRET saturation curve was compared with the one obtained in the absence of ionomycin (dotted line; see Fig. 6).
FIGURE 8.
FIGURE 8.
Effect of intracellular Ca2+ on A2A receptor-, D2 receptor-, and A2A-D2 receptor heteromer-mediated ERK1/2 phosphorylation. HEK-293 cells expressing A2A receptor (1.2 μg of cDNA) or D2 receptor (1 μg of cDNA) and CaM (0.3 μg of cDNA) (A); A2A receptor (1.2 μg of cDNA), D2R (1 μg of cDNA), and CaM (0.3 μg of cDNA) (B); or A2A receptor (1.2 μg of cDNA) and D2R (1 μg of cDNA) (C) were placed in HBSS buffer containing 1.26 mm CaCl2 and treated 3 min with vehicle or with 1 μm ionomycin before the addition of the A2A receptor agonist CGS21680 (200 nm; CGS), the D2 receptor agonist quinpirole (1 μm), or both. A representative Western blot from ERK1/2 phosphorylation assays, which were performed as described under “Experimental Procedures,” is shown. No significant differences in the basal levels were detected by the presence of CaM or CaM plus ionomycin. The immunoreactive bands from 4–6 independent experiments were quantified, and values represent the mean ± S.E. of percentage of increase of phosphorylation over the basal levels (100%) found in ionomycin-untreated or -treated cells. Significant differences of agonist-treated versus basal (*) or agonist-treated in the presence versus the absence of ionomycin (&) were calculated by one-way analysis of variance and Bonferroni test (* and &, p < 0.05; ** and &&, p < 0.01; *** and &&&, p < 0.005).

Similar articles

Cited by

References

    1. Agnati L. F., Ferré S., Lluis C., Franco R., Fuxe K. (2003) Pharmacol. Rev. 55, 509–550 - PubMed
    1. Pin J. P., Neubig R., Bouvier M., Devi L., Filizola M., Javitch J. A., Lohse M. J., Milligan G., Palczewski K., Parmentier M., Spedding M. (2007) Pharmacol. Rev. 59, 5–13 - PubMed
    1. Lee S. P., O'Dowd B. F., George S. R. (2003) Life Sci. 74, 173–180 - PubMed
    1. Rashid A. J., So C. H., Kong M. M., Furtak T., El-Ghundi M., Cheng R., O'Dowd B. F., George S. R. (2007) Proc. Natl. Acad. Sci. U.S.A. 104, 654–659 - PMC - PubMed
    1. Prinster S. C., Holmqvist T. G., Hall R. A. (2006) J. Pharmacol. Exp. Ther. 318, 974–981 - PubMed

Publication types

MeSH terms