

doi: 10.1093/bioinformatics/btp454.
Epub 2009 Jul 24.
PhyloDet: a scalable visualization tool for mapping multiple traits to large evolutionary trees
Affiliations
- PMID: 19633096
- PMCID: PMC2752614
- DOI: 10.1093/bioinformatics/btp454
Item in Clipboard
PhyloDet: a scalable visualization tool for mapping multiple traits to large evolutionary trees
Bioinformatics.
.
Abstract
Evolutionary biologists are often interested in finding correlations among biological traits across a number of species, as such correlations may lead to testable hypotheses about the underlying function. Because some species are more closely related than others, computing and visualizing these correlations must be done in the context of the evolutionary tree that relates species. In this note, we introduce PhyloDet (short for PhyloDetective), an evolutionary tree visualization tool that enables biologists to visualize multiple traits mapped to the tree.
Availability: http://research.microsoft.com/cue/phylodet/
Figures
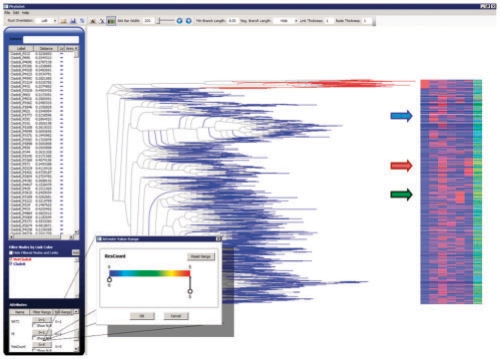
PhyloDet, here showing six traits mapped to 1134 HIV sequences and their evolutionary tree. The arrows, added for illustration, highlight the clustering of attributes corresponding to IDU (blue), PI (red) and NRTI (green). The dialogue box allows a user to drag the circular tabs to specify a range of values that should be displayed. The current box is for the number of drugs to which an HIV sequence is resistant.
References
-
- Felsenstein J. Phylogenies and the comparative method. Am. Nat. 1985;125:1–15.
-
- Harrigan PR, et al. Predictors of HIV drug-resistance mutations in a large antiretroviral-naive cohort initiating triple antiretroviral therapy. J. Infect. Dis. 2005;191:339–347. - PubMed
-
- Lee B, et al. MSR Tech Report MSR-TR-2008-97. Microsoft Research; 2008. Det. (Distance Encoded Tree): a scalable visualization tool for mapping multiple traits to large evolutionary trees. - PubMed
