. 2009 Aug;136(16):2717-24.
doi: 10.1242/dev.038679.

Beta1 integrins are required for normal CNS myelination and promote AKT-dependent myelin outgrowth

Affiliations

Beta1 integrins are required for normal CNS myelination and promote AKT-dependent myelin outgrowth

Claudia S Barros et al. Development. 2009 Aug.

Abstract

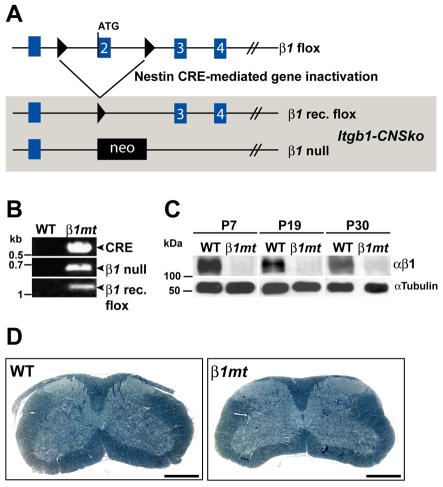
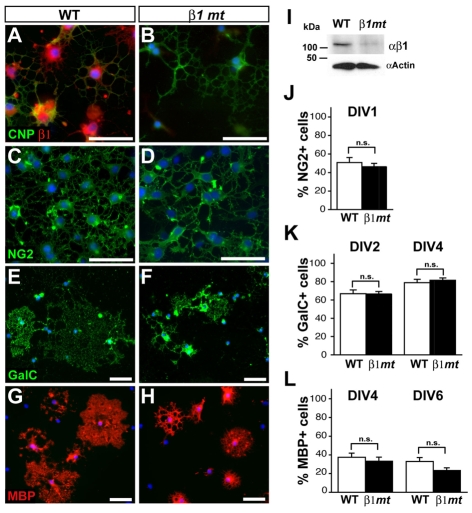
Oligodendrocytes in the central nervous system (CNS) produce myelin sheaths that insulate axons to ensure fast propagation of action potentials. beta1 integrins regulate the myelination of peripheral nerves, but their function during the myelination of axonal tracts in the CNS is unclear. Here we show that genetically modified mice lacking beta1 integrins in the CNS present a deficit in myelination but no defects in the development of the oligodendroglial lineage. Instead, in vitro data show that beta1 integrins regulate the outgrowth of myelin sheaths. Oligodendrocytes derived from mutant mice are unable to efficiently extend myelin sheets and fail to activate AKT (also known as AKT1), a kinase that is crucial for axonal ensheathment. The inhibition of PTEN, a negative regulator of AKT, or the expression of a constitutively active form of AKT restores myelin outgrowth in cultured beta1-deficient oligodendrocytes. Our data suggest that beta1 integrins play an instructive role in CNS myelination by promoting myelin wrapping in a process that depends on AKT.


Figures

Fig. 1.
Fig. 1.
CRE-mediated gene inactivation leads to loss of β1 integrin protein. (A) Diagram of nestin-Cre-mediated gene inactivation in Itgb1-CNSko mice mutants. The Itgb1 (encodes β1 integrin) floxed allele before and after recombination (rec) and the Itgb1-null allele are shown. LoxP sites are indicated as black triangles, exons (blue boxes) are numbered. neo indicates neomycin cassette. (B) DNA from the P19 spinal cord of WT and Itgb1-CNSko mice (β1mt) was analyzed by PCR. With DNA from Itgb1-CNSko mice, bands corresponding to the nestin-Cre transgene, the Itgb1-null allele and the recombined Itgb1-flox allele were detected. (C) Immunoblotting with β1 integrin antibody using spinal cord extracts from mice at P7, P19 and P30 showed loss of β1 protein in the mutants. Tubulin served as a loading control. (D) Spinal cord sections from WT and Itgb1-CNSko mice at P30 stained with Toluidine Blue. No obvious differences in overall morphology were detected. Scale bar: 500 μm.
Fig. 2.
Fig. 2.
Myelination defects in the spinal cords of Itgb1-CNSko mutants. (A) Electron microscopy (EM) analysis of myelinated fibers in spinal cord sections from P30 Itgb1-CNSko and WT mice. Asterisks indicate axons of similar size. Insets in lower panels show higher magnifications of myelin wraps from indicated axons. Scale bars: 5 μm; 100 nm for insets in lower panels. (B) G-ratio (axon diameter/fiber diameter) of fibers grouped by axon diameter. Values are shown as mean±s.e.m. In Itgb1-CNSko mutants, the g-ratio was significantly increased, with the exception of axons with a diameter less than 0.7 μm. See Table S1 in the supplementary material for statistical values. (C,D) No significant change was detected in either the density (C) or size (diameter, D) of axons in Itgb1-CNSko mutants [density: β1mt 0.101±0.01/μm2 (103.52±1.14% with respect to WT), WT 0.097± 0.01/μm2, P>0.05, n=1660 axons from three WT, n=2009 axons from three Itgb1-CNSko mutants; size (diameter): β1mt 1.61±0.03 μm, WT 1.59±0.03 μm, P>0.05, n=1660 axons from three WT, n=2009 axons from three Itgb1-CNSko mutants]. Values are shown as mean±s.e.m. (E) Immunobloting for MBP and PLP in spinal cord extracts from P7 and P30 Itgb1-CNSko mutant and WT mice. Tubulin served as a control for loading and subsequent densitometry analysis. In mutant spinal cords at P7, the relative levels of MBP and PLP proteins were reduced by 23.1±2.5% (n=3, ***P<0.001) and 24.9±6.8% (n=3, *P<0.05), respectively. At P30, MBP and PLP levels were decreased in mutant spinal cords by 36.5±12.1% (n=3, *P<0.05) and 13.5±3% (n=2, *P<0.05), respectively. n.s., not significant.
Fig. 3.
Fig. 3.
Myelination defects in the optic nerves and cerebellum of Itgb1-CNSko mutants. (A,B) EM analysis of myelinated fibers in optic nerve (A) and cerebellum (B) cross-sections from P30 Itgb1-CNSko and WT mice. Asterisks indicate axons of similar size. The g-ratios (diameter axon/diameter fiber) of fibers grouped by axon diameter are also shown (mean±s.e.m.). In Itgb1-CNSko mutant optic nerves and cerebellum there was an increase in the g-ratio of fibers with larger axonal calibers compared with WT. See Table S1 in the supplementary material for statistical data. n.s., not significant. Scale bars: 1 μm.
Fig. 4.
Fig. 4.
Myelination defects in the spinal cords of Itgb1-OL-ko mutants derived using Ng2-Cre. (A) EM analysis of myelinated fibers in spinal cord sections from P30 Itgb1-OL-ko and WT mice generated using the Ng2-Cre driver. (B) Higher magnification of fibers boxed in A. (C) G-ratio of fibers grouped by axon diameter (mean±s.e.m.). In Itgb1-OL-ko mutants, the g-ratio was significantly increased in axons with a diameter between 0.7 and 2.5 μm. n.s., not significant. See Table S1 in the supplementary material for statistical values. Scale bars: 5 μm in A; 2.5 μm in B.
Fig. 5.
Fig. 5.
Normal oligodendrocyte lineage progression in Itgb1-CNSko mice. (A-F) Spinal cord cross-sections from Itgb1-CNSko and WT mice immunostained with antibodies against the oligodendrocyte progenitor marker PDGFαR (green) at P0 and the mature oligodendrocyte marker APC at P19 and P60 (CC1 antibody, green). Dashed lines mark spinal cord borders and central canal. Scale bars: 100 μm. (G,H) Cell density quantifications (mean±s.e.m.) showed no significant decrease (n.s.) in the numbers of PDGFαR (G)- or CC1 (H)-positive cells in Itgb1-CNSko mutants.
Fig. 6.
Fig. 6.
Normal lineage progression in cultured Itgb1-CNSko-derived oligodendrocytes. Oligodendrocyte progenitors obtained from Itgb1-CNSko or WT brains were differentiated for 1, 2, 4 or 6 days in vitro (DIV). Immunocytochemistry was used to visualize the oligodendroglia marker CNP (green) and β1 integrin (red) at 2 DIV (A,B), the oligodendrocyte progenitor marker NG2 (green) at 1 DIV (C,D), the premyelinating oligodendrocyte marker GALC (green) at 4 DIV (E,F) and the mature oligodendrocyte marker MBP (red) at 4 DIV (G,H). All images show counterstaining with DAPI to visualize nuclei (blue). Scale bars: 50 μm. (I) Western blot analysis of lysates obtained from oligodendrocytes purified from wild-type and Itgb1-CNSko mice revealed a severe reduction in the levels of β1 integrin protein in mutant cells (β1mt). Actin blots were performed as a loading control. (J-L) Quantification of the percentage of cells expressing NG2 at 1 DIV (J); GALC at 2 and 4 DIV (K); and MBP at 4 and 6 DIV (L) revealed no differences between Itgb1-CNSko- and WT-derived cells. Values are shown as mean±s.e.m. n.s., not significant.
Fig. 7.
Fig. 7.
Itgb1-CNSko oligodendrocytes have smaller myelin membrane sheets. (A) Oligodendrocytes derived from WT and Itgb1-CNSko mice were differentiated for 4 DIV, then visualized using MBP immunocytochemistry (green) and counterstained with DAPI (blue). (B) Percentage of MBP-positive oligodendrocytes containing visible sheet-like morphology at 2 and 4 DIV. Values are shown as mean±s.e.m. At 2 DIV, β1-deficient oligodendrocytes contained significantly fewer sheets than WT counterparts (*P<0.05). The difference was not significant (n.s.) at 4 DIV. (C) The mean area of MBP-positive myelin membranes (mean±s.e.m.) was smaller in β1-deficient oligodendrocytes at 2 and 4 DIV (*P<0.05). (D) The length of the longest process within each myelin membrane sheet (mean±s.e.m.) was significantly shorter in mutant oligodendrocytes at 4 DIV (*P<0.05). (E) The area of MBP-positive myelin sheets (mean±s.e.m.) was compared with mixed glial cultures obtained from WT or Itgb1-CNSko spinal cords at P0. Spinal cord oligodendrocytes from mutant mice generated smaller myelin membrane sheets at 4 DIV (*P<0.05). (F-G″) Representative pictures depicting morphometric analysis performed on MBP-positive (green) wild-type (F-F″) and β1 mutant (G-G″) oligodendrocytes. Scale bars: 50 μm.
Fig. 8.
Fig. 8.
β1 integrin function in myelin sheet outgrowth is mediated by AKT. (A) Oligodendrocytes derived from either from WT or Itgb1-CNSko brains were cultured on laminin and stimulated with neuregulin 1 (NRG1) at 1 DIV and evaluated by western blot to detect pAKT (phospho-Ser473) and total AKT. Densitometry of western blots is also shown. Only WT oligodendrocytes showed an increase in relative AKT phosphorylation (ratio of pAKT/total AKT) upon stimulation (mean±s.e.m.; *P<0.05). (B) Wild-type rat oligodendrocytes were treated with control (ctrl), dystroglycan (DG)- or β1-integrin-blocking antibodies followed by stimulation with neuregulin 1 (NRG1) at 1 DIV. Cells were lysed and evaluated by western blot to detect pAKT (phospho-Ser473) and total AKT. Densitometry of blots is also shown. Cells treated with control or dystroglycan-blocking antibodies, but not β1-integrin-blocking antibodies, showed a significant increase in relative AKT phosphorylation (ratio of pAKT/total AKT) upon stimulation (mean±s.e.m.; **P<0.01). (C) WT and β1-deficient oligodendrocytes differentiated for 4 DIV in the presence or absence of the PTEN inhibitor bpV were visualized using MBP antibody (red) and counterstained with DAPI (blue). The area of MBP-positive myelin sheets after 4 DIV in the presence or absence of bpV (mean±s.e.m.) was calculated. Mutant oligodendrocytes showed sheets of WT size after treatment with bpV (*P<0.05). (D) WT and β1-deficient mixed glial cells were transfected with either CA-AKT-GFP or control GFP constructs and evaluated by immunocytochemistry to monitor construct expression (GFP, green) and MBP-positive myelin membrane (MBP, red). The area of MBP-positive myelin sheets in the presence of CA-AKT or control GFP is shown (mean±s.e.m.). Mutant oligodendrocytes transfected with CA-AKT showed sheets significantly larger than mutant oligodendrocytes transfected with control GFP (**P<0.01). Scale bars: 50 μm.

Similar articles

Cited by

References

    1. Belvindrah, R., Graus-Porta, D., Goebbels, S., Nave, K. A. and Muller, U. (2007). Beta1 integrins in radial glia but not in migrating neurons are essential for the formation of cell layers in the cerebral cortex. J. Neurosci. 27, 13854-13865. - PMC - PubMed
    1. Benninger, Y., Colognato, H., Thurnherr, T., Franklin, R. J., Leone, D. P., Atanasoski, S., Nave, K. A., ffrench-Constant, C., Suter, U. and Relvas, J. B. (2006). Beta1-integrin signaling mediates premyelinating oligodendrocyte survival but is not required for CNS myelination and remyelination. J. Neurosci. 26, 7665-7673. - PMC - PubMed
    1. Berti, C., Nodari, A., Wrabetz, L. and Feltri, M. L. (2006). Role of integrins in peripheral nerves and hereditary neuropathies. Neuromolecular Med. 8, 191-204. - PubMed
    1. Blaess, S., Graus-Porta, D., Belvindrah, R., Radakovits, R., Pons, S., Littlewood-Evans, A., Senften, M., Guo, H., Li, Y., Miner, J. H. et al. (2004). Beta1-integrins are critical for cerebellar granule cell precursor proliferation. J. Neurosci. 24, 3402-3412. - PMC - PubMed
    1. Buttery, P. C. and ffrench-Constant, C. (1999). Laminin-2/integrin interactions enhance myelin membrane formation by oligodendrocytes. Mol. Cell. Neurosci. 14, 199-212. - PubMed

Publication types