. 2009 Sep;151(1):155-67.
doi: 10.1104/pp.109.140111. Epub 2009 Jul 24.

Auxin stimulates its own transport by shaping actin filaments

Affiliations

Auxin stimulates its own transport by shaping actin filaments

Peter Nick et al. Plant Physiol. 2009 Sep.

Abstract

The directional transport of the plant hormone auxin has been identified as central element of axis formation and patterning in plants. This directionality of transport depends on gradients, across the cell, of auxin-efflux carriers that continuously cycle between plasma membrane and intracellular compartments. This cycling has been proposed to depend on actin filaments. However, the role of actin for the polarity of auxin transport has been disputed. The organization of actin, in turn, has been shown to be under control of auxin. By overexpression of the actin-binding protein talin, we have generated transgenic rice (Oryza sativa) lines, where actin filaments are bundled to variable extent and, in consequence, display a reduced dynamics. We show that this bundling of actin filaments correlates with impaired gravitropism and reduced longitudinal transport of auxin. We can restore a normal actin configuration by addition of exogenous auxins and restore gravitropism as well as polar auxin transport. This rescue is mediated by indole-3-acetic acid and 1-naphthyl acetic acid but not by 2,4-dichlorophenoxyacetic acid. We interpret these findings in the context of a self-referring regulatory circuit between polar auxin transport and actin organization. This circuit might contribute to the self-amplification of auxin transport that is a central element in current models of auxin-dependent patterning.


Figures
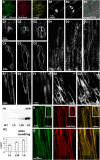
Figure 1.
Figure 1.
Visualization of actin filaments in rice seedlings through stable expression of YFP-mT. A, Dual visualization of actin filaments through YFP-mT (green) versus conventional staining with TexasRed-conjugated phalloidin (TexR-Phall; red) in the moderate expressor line L5. The merge of the two channels (yellow) shows high congruence for the two modes of visualization. B, Polar meshwork of actin filaments extending through cross-walls (white arrows), confocal sections of a fully expanded coleoptile epidermal cell (B1 and B2), and merge of YFP and differential interference contrast (DIC) image (B3). C, Reorganization of actin filaments during elongation of guard cells and confocal sections of a guard cell recorded at day 4 after germination (C1–C3) and after full expansion of the coleoptile at day 6 after germination (C4–C6). D, Tissue-specific organization of actin filaments in the primary roots, confocal sections of epidermis (D1 and D2), and cortex (D3). The images in A to D were recorded in the moderate expressor line L5. E to H, Dependence of actin organization on the level of expression of YFP-talin. Confocal sections of epidermal cells in fully expanded coleoptiles of transgenic lines L5 (moderate expression; E1 and E2), L26 (high expression; F1), and L6 (very high expression; G1 and G2). The expression of YFP-mT was probed by western blotting of total coleoptile extracts using a polyclonal anti-FP antibody (H1), and the apparent mean width of actin strands (w; see Fig. 4C) was assessed as measure for the degree of actin bundling (H2). WT, Wild type. I, Dual visualization of actin filaments through YFP-mT (green) and TexasRed-conjugated phalloidin (red) in the high-expression line L6 to test whether the diffuse YFP signal is produced by F-actin. The global view is shown in I1; the inset is zoomed in I2 to show the congruence between the diffuse YFP signal with the TexasRed signal.
Figure 2.
Figure 2.
Dynamics of actin filaments in epidermal cells expressing moderate (A) or very high (B) levels of YFP-mT. A and B, Time-lapse series of individual filaments in L5 (moderate expression; A) or L6 (very high expression; B). Bundles of comparable thickness are shown. Bars = 2.5 μm. C, Illustration of the method used to quantify actin dynamics. Two subsequent frames of a time-lapse series (t1 and t2) are subtracted to yield the differential |t1 − t2|. The pixel intensities of this differential increase proportional to the shifts of the filaments between t1 and t2. D, Typical histogram over the change in pixel intensity between subsequent snapshots of a time-lapse series recorded in L5 and L6 as indicator for actin dynamics. The red line shows the respective median values. E, Average shifts of pixel intensity (median values of histograms as shown in D) over time in individual cells of lines L5 and L6, respectively. F, Average values of histogram averages (as shown in E) over populations of epidermal cells from L5 (moderate expression; white bars) or L6 (very high expression; black bars) in control plants (−Pha) or after treatment with 1 μm phalloidin for 1 h (+Pha), respectively. Between 53 and 62 individual cells were scored for each line. G, Response of actin filaments to treatment with 10 μm LatB in L5.
Figure 3.
Figure 3.
Effect of YFP-mT on coleoptile growth and gravitropism. A, Mean gravitropic curvature over the YFP signal measured by western blotting and classified in relation to the strongest protein signal (observed in the line L6). The strongest group of expressors contains the lines L6, L18, L26, and L35. The graph represents data from 20 individual coleoptiles per line measured in two independent experimental series. B, Dose response of auxin-induced elongation over LatB in the wild type, the moderate YFP-mT expressor L5, and the strong YFP-mT overexpressor L6. Auxin-induced growth was triggered in coleoptile segments by addition of 5 μm IAA and recorded after 3 h of incubation. C, Dose response of elongation over IAA measured after 3 h of incubation. D and E, Dose response of gravitropic curvature over LatB in the wild type, L5, and L6 plotted as absolute mean curvature (D) and normalized to the mean curvature in the absence of the inhibitor (E). F and G, Dose response of gravitropism over auxin in the wild type, L5, and L6, plotted as absolute mean curvature (F) and normalized to the mean curvature in the absence of the inhibitor (G). Gravitropic curvature was recorded after 2 h throughout. WT, Wild type.
Figure 4.
Figure 4.
Effect of auxin on actin organization. A, Debundling of actin in response to 50 μm IAA added at time 0 min to coleoptiles of the strong expressor line L6. Projections of confocal stacks are shown. B, Bundling of actin after decapitation of coleoptiles of the moderate expressor line L5. Projections of z-stacks at times 0 and 30 min. C, Definition of the numerical parameters n and w to describe actin organization. n represents the mean number of actin strands over a transverse profile of defined length (i.e. the density of filaments), and w is the mean width of actin strands. Five probing lines of 8 pixel (px) width were laid over each cell to determine n and w as average over the values obtained on each probing line. D and E, Time course for the response of n (left) and w (right) to 5 μm IAA (D) and 50 μm IAA (E) in the lines L5 (moderate expression), L26 (moderate expression), and L6 (strong expression). A total of 350 individual cells were scored for each line. F and G, Response of n (F) and w (G) in the lines L5 (moderate expression; white bars) and L6 (strong expression) to different species of auxin administered for 1 h at 10 μm. Data represent the mean from 100 individual cells.
Figure 5.
Figure 5.
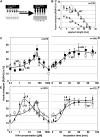
Effect of auxin on basipetal auxin transport. A, Quantification of polar auxin transport using 14C-IAA applied through a donor block and measuring the radioactivity recovered in the receiver block as percentage of total radioactivity in segment and receiver. B, Dependence of radioactivity recovered in the receiver from segment length. C and E, Dose response of auxin transport over exogenous IAA in the wild type, L5, and L26 (moderate expression; C) compared to L6 and L18 (strong expression; E). D and F, Time course for the stimulation of auxin transport by IAA in the wild type, L5, and L26 (moderate expression; D) compared to L6 and L18 (strong expression; F). n, Numbers of coleoptiles per experiment; WT, wild type.
Figure 6.
Figure 6.
Model for the functional effects of talin overexpression in rice. Fine actin filaments in wild type and moderate talin expressors support the polar localization of auxin efflux carriers and thus efficient auxin transport. Due to the role of actin in cell elongation, they also support efficient elongation of coleoptile segments in response to exogenous IAA. Both actin functions (auxin transport and cell elongation) contribute to the efficient gravitropism of rice coleoptiles. In strong talin expressors, excessive actin bundling impairs the polar localization of auxin efflux carriers and, thus, auxin transport. In addition, the elongation response to exogenous IAA is reduced. Both effects lead to a reduced gravitropic response.

Similar articles

Cited by

References

    1. Berleth T, Sachs T (2001) Plant morphogenesis: long-distance coordination and local patterning. Curr Opin Plant Biol 4 57–62 - PubMed
    1. Blakeslee JJ, Peer WA, Murphy AS (2005) Auxin transport. Curr Opin Plant Biol 8 494–500 - PubMed
    1. Brandizzi F, Snapp EL, Roberts AG, Lippincott-Schwartz J, Hawes C (2002) Membrane protein transport between the endoplasmic reticulum and the Golgi in tobacco leaves is energy dependent but cytoskeleton independent: evidence from selective photobleaching. Plant Cell 14 1293–1309 - PMC - PubMed
    1. Butler JH, Hu S, Brady SR, Dixon MW, Muday GK (1998) In vitro and in vivo evidence for actin association of the naphthylphthalamic acid-binding protein from zucchini hypocotyls. Plant J 13 291–301 - PubMed
    1. Cande WZ, Goldsmith MHM, Ray PM (1973) Polar auxin transport and auxin-induced elongation in the absence of cytoplasmic streaming. Planta 111 279–296 - PubMed

Publication types

MeSH terms