. 2009 Sep;8(9):1381-96.
doi: 10.1128/EC.00121-09. Epub 2009 Jul 24.

How a cell crawls and the role of cortical myosin II

Affiliations

How a cell crawls and the role of cortical myosin II

David R Soll et al. Eukaryot Cell. 2009 Sep.

Abstract

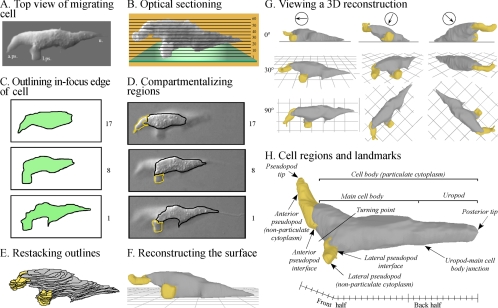
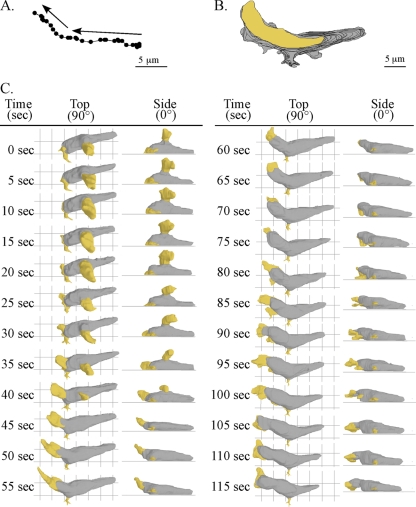
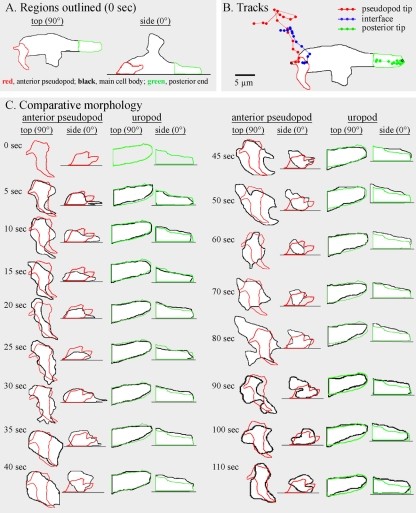
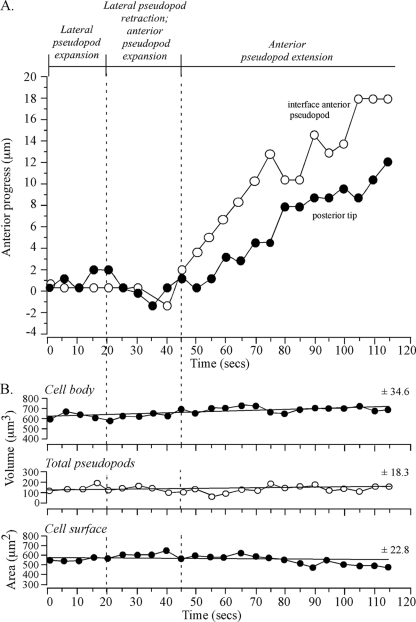
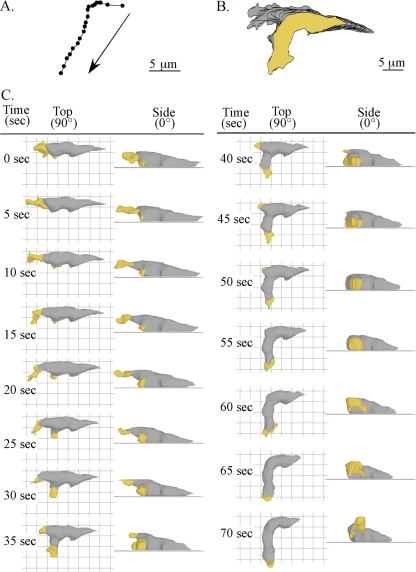
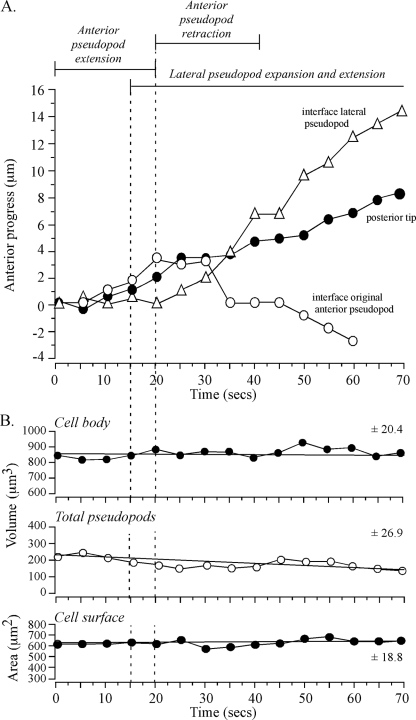
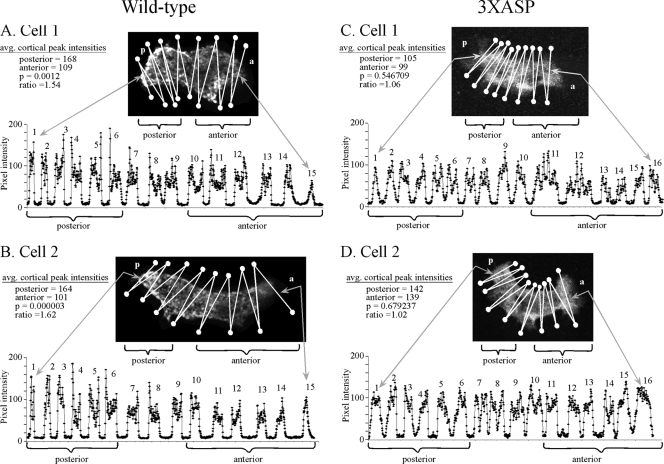
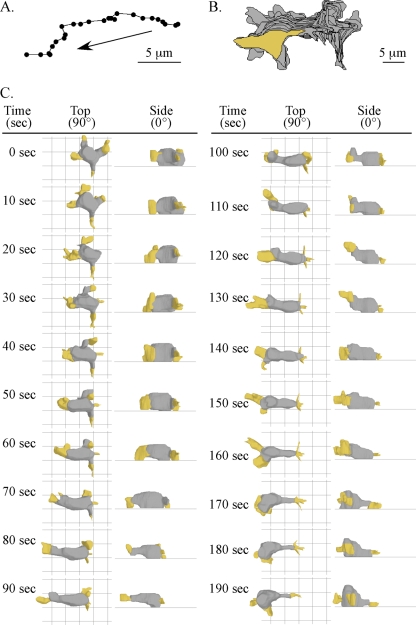
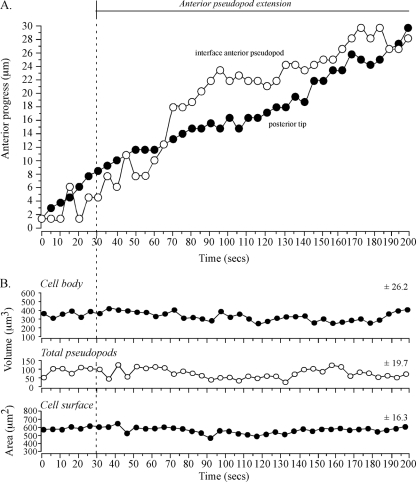
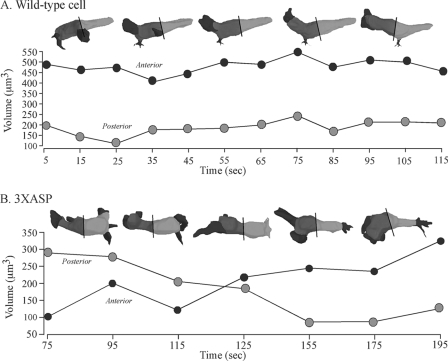
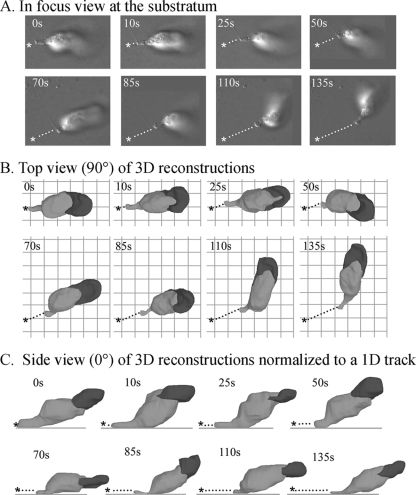
The movements of Dictyostelium discoideum amoebae translocating on a glass surface in the absence of chemoattractant have been reconstructed at 5-second intervals and motion analyzed by employing 3D-DIAS software. A morphometric analysis of pseudopods, the main cell body, and the uropod provides a comprehensive description of the basic motile behavior of a cell in four dimensions (4D), resulting in a list of 18 characteristics. A similar analysis of the myosin II phosphorylation mutant 3XASP reveals a role for the cortical localization of myosin II in the suppression of lateral pseudopods, formation of the uropod, cytoplasmic distribution of cytoplasm in the main cell body, and efficient motility. The results of the morphometric analysis suggest that pseudopods, the main cell body, and the uropod represent three motility compartments that are coordinated for efficient translocation. It provides a contextual framework for interpreting the effects of mutations, inhibitors, and chemoattractants on the basic motile behavior of D. discoideum. The generality of the characteristics of the basic motile behavior of D. discoideum must now be tested by similar 4D analyses of the motility of amoeboid cells of higher eukaryotic cells, in particular human polymorphonuclear leukocytes.


Figures

FIG. 1.
FIG. 1.
The 3D-DIAS software program provides 3D reconstructions of a live, translocating cell at time intervals and demarcation of cell regions and landmarks. (A) A top view of the stacked sections of a D. discoideum amoeba obtained by differential interference contrast microscopy. The anterior pseudopod (a. ps.) and lateral pseudopod (l. ps.) and uropod (u.) are indicated. (B) A side view of 60 stacked optical sections, all collected within a 2-second period. (C) Outlining of the in-focus edge of the cell perimeter of each optical section. (D) In each outline, the perimeter of nonparticulate cytoplasm is yellow and that of particulate cytoplasm is black. (E) The outlines are then stacked. (F) A 3D-DIAS software program smoothes the edges of outlines by beta-spline replacement windows and then connects them in the z axis to generate a 3D reconstruction, in which the cell body and the pseudopods are color coded gray and yellow, respectively. Smoothing procedures are applied. (G) Reconstructions can be viewed at any angle. The posterior-anterior axis is indicated by an arrow in a circle above the three columns of images, and the angle of view (0°, side; 90°, from on top) is shown to the left of the three rows of images. (H) Particular cell regions and landmarks germane to the analysis are denoted. In panels C and D, numbers refer to optical sections 1, 8, and 17.
FIG. 2.
FIG. 2.
Motion analysis and 3D reconstruction of a representative cell undergoing a soft turn (∼45°). (A) The track of the cell centroids (centers of mass) in 2D over 115 seconds. The arrows show the direction of travel. (B) The track of the cell perimeters in 2D over 115 s. The area of the last position of the cell is shown in yellow, and the areas of the preceding positions are shown in gray. (C) 3D reconstructions of the translocating cell every 5 s. The pseudopods are color coded yellow, and the cell bodies are color coded gray. Top (90°) and side views (0°) are presented at each time point.
FIG. 3.
FIG. 3.
When a cell translocates, the anterior pseudopod continually changes shape, but the posterior portion of the cell that includes the uropod maintains a relatively constant shape. The representative cell is the same one analyzed in Fig. 2. (A) Color coding of the outlined regions at time zero. (B) Tracks of the anterior tip (red), interface (blue), and posterior tip (green) over a 115-second period. (C) Comparison of the shapes of the anterior pseudopod and posterior portion of the cell. At each time point, the new outline in black is superimposed over the red outline at 0 second to assess changes in shape. Top (90°) and side (0°) views are presented at each time point.
FIG. 4.
FIG. 4.
Anterior progress of the interface and posterior tip is coordinated in a cell undergoing a soft turn (∼45°) during anterior pseudopod extension. No dramatic changes in pseudopod volume, cell body volume, or cell surface correlate with the onset of anterior pseudopod expansion at 20 seconds or anterior pseudopod extension at 45 seconds. The representative cell is the same one shown in Fig. 2. (A) Time plots of anterior progress of the interface and posterior tip. Pseudopod dynamics are delineated at the tip of the graph. (B) Time plots of cell body volume, total (collective) pseudopod volume, and cell surface area. Vertical dashed lines denote landmark events. The best-fit lines and the mean deviation from the best-fit line (± standard deviation) are presented for each of the three parameters analyzed.
FIG. 5.
FIG. 5.
Motion analysis and 3D reconstruction of a representative cell that formed a lateral pseudopod and turned into it, causing a sharp left turn. The figure is set up in the same way as Fig. 2; see the legend to Fig. 2 for descriptions of the panels.
FIG. 6.
FIG. 6.
Anterior progress of the interface of a new lateral pseudopod and progress of the posterior tip of a cell undergoing a sharp turn (∼90°) are coordinated. While the new pseudopod is progressing away from the cell, the interface of the original anterior pseudopod moves in the opposite direction (toward the cell body) in the process of retraction. No dramatic changes in total pseudopod volume, cell body volume, or cell surface area correlate with formation, expansion, and extension of the new lateral pseudopod or with retraction of the old anterior pseudopod. The representative cell analyzed is the same one analyzed in Fig. 5. (A) Time plots of anterior progress of the interface of the new anterior pseudopod, the interface of the original (old) anterior pseudopod, and the posterior tip. Pseudopod dynamics are delineated at the top of the graph. (B) Time plots of cell body volume, total pseudopod volume, and cell surface area. Vertical dashed lines denote landmark events. The best-fit lines and the mean deviation from the line are presented for each of the three parameters analyzed.
FIG. 7.
FIG. 7.
Myosin II is localized in the posterior cortex of wild-type cells, but not in the posterior cortex of mutant 3XASP cells. Cells were stained with anti-myosin II antibody and optically sectioned in the z axis by laser scanning confocal microscopy. A projection image derived from the center of section 5 was then scanned for pixel intensity using a zigzag track that crossed the cell 15 times. When the intensity scan crossed the cell, a broad peak of pixel intensities was generated. When it moved outside the cell, a trough of low-level pixel intensity was generated. It is the pixel intensities at the edges of each broad peak that represent cortical regions. For each cell, the average (avg.) cortical intensities (i.e., the average intensities of the outside pixels of the broad peaks) for the anterior (a) and posterior (p) halves of the cell, the ratio of the posterior to anterior values, and the p values for significance are shown. Representative wild-type cells (A and B) and representative 3XASP cells (C and D) are shown.
FIG. 8.
FIG. 8.
Motion analysis and 3D reconstruction of a representative 3XASP cell. The figure is set up in the same way as Fig. 2; see the legend to Fig. 2 for descriptions of the panels.
FIG. 9.
FIG. 9.
Anterior progress of the interface of the anterior pseudopod and progress of the posterior end of a 3XASP cell are coordinated. No dramatic changes in total pseudopod volume, cell body volume, or cell surface correlate with expansion, extension, or retraction of the anterior pseudopod or with formation of a new lateral pseudopod. The figure is set up in the same way as Fig. 4, except that landmark tracks are not plotted; see the legend to Fig. 4 for descriptions of the panels.
FIG. 10.
FIG. 10.
In wild-type cells, the bulk of the cytoplasm is maintained anteriorly as the cell translocates, but in 3XASP cells, the distribution relocates transiently to the posterior half of the cell body. (A) The volume of the anterior and posterior half of a representative wild-type cell over time (shown in seconds). (B) The volume of the anterior and posterior halves of a representative 3XASP cell over time. The line through the reconstruction of the cell at each time point delineates the anterior (dark gray) and posterior (light gray) halves of the cell body. The pseudopods are color coded black.
FIG. 11.
FIG. 11.
Cells can translocate anteriorly in a persistent fashion when adhering to the substrate only by their uropod. Cells were incubated in Tricine buffer containing 80 mM CaCl2, which has been shown to block selectively adhesion to a substratum by the main cell body and anterior pseudopod, but not adhesion of the uropod (46). (A) Track of the posterior tip of a representative cell imaged through differential interference contrast optics at the substratum. (B) Track of the posterior tip of 3D reconstructions observed from on top (90°). (C) Track of the posterior tip of 3D reconstructions observed from the side (0°). The original position (asterisk) and translocation track (dotted line) of the posterior tip are indicated. s, seconds.

References

    1. Ananthakrishnan, R., and A. Ehrlicher. 2007. The forces behind cell movement. Int. J. Biol. Sci. 3:303-317. - PMC - PubMed
    1. Andrew, N., and R. H. Insall. 2007. Chemotaxis in shallow gradients is mediated independently of PtdIns 3-kinase by biased choices between random protrusions. Nat. Cell Biol. 9:193-200. - PubMed
    1. Bonner, J. T., D. S. Barkley, E. M. Hall, T. M. Konijn, J. W. Mason, G. O'Keefe III, and P. B. Wolfe. 1969. Acrasin, acrasinase, and the sensitivity to acrasin in Dictyostelium discoideum. Dev. Biol. 20:72-87. - PubMed
    1. Bosgraaf, L., and P. J. van Haastert. 2006. The regulation of myosin II in Dictyostelium. Eur. J. Cell Biol. 85:969-979. - PubMed
    1. Bottino, D., A. Mogilner, T. Roberts, M. Stewart, and G. Oster. 2002. How nematode sperm crawl. J. Cell Sci. 115:367-384. - PubMed

Publication types

LinkOut - more resources