. 2009 Sep 25;284(39):26951-63.
doi: 10.1074/jbc.M109.013706. Epub 2009 Jul 24.

Structure of the Plasmodium falciparum circumsporozoite protein, a leading malaria vaccine candidate

Affiliations

Structure of the Plasmodium falciparum circumsporozoite protein, a leading malaria vaccine candidate

Matthew L Plassmeyer et al. J Biol Chem. .

Abstract

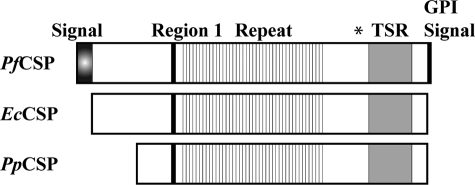
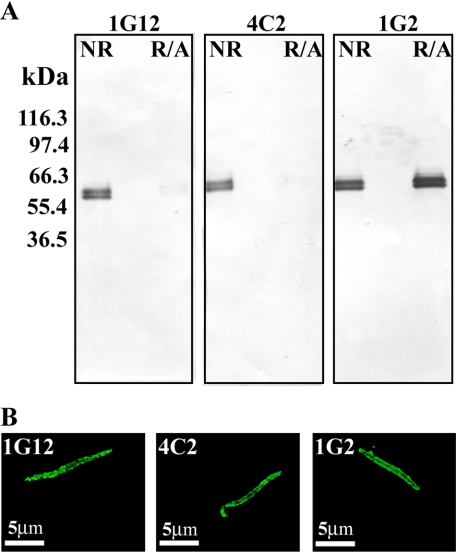
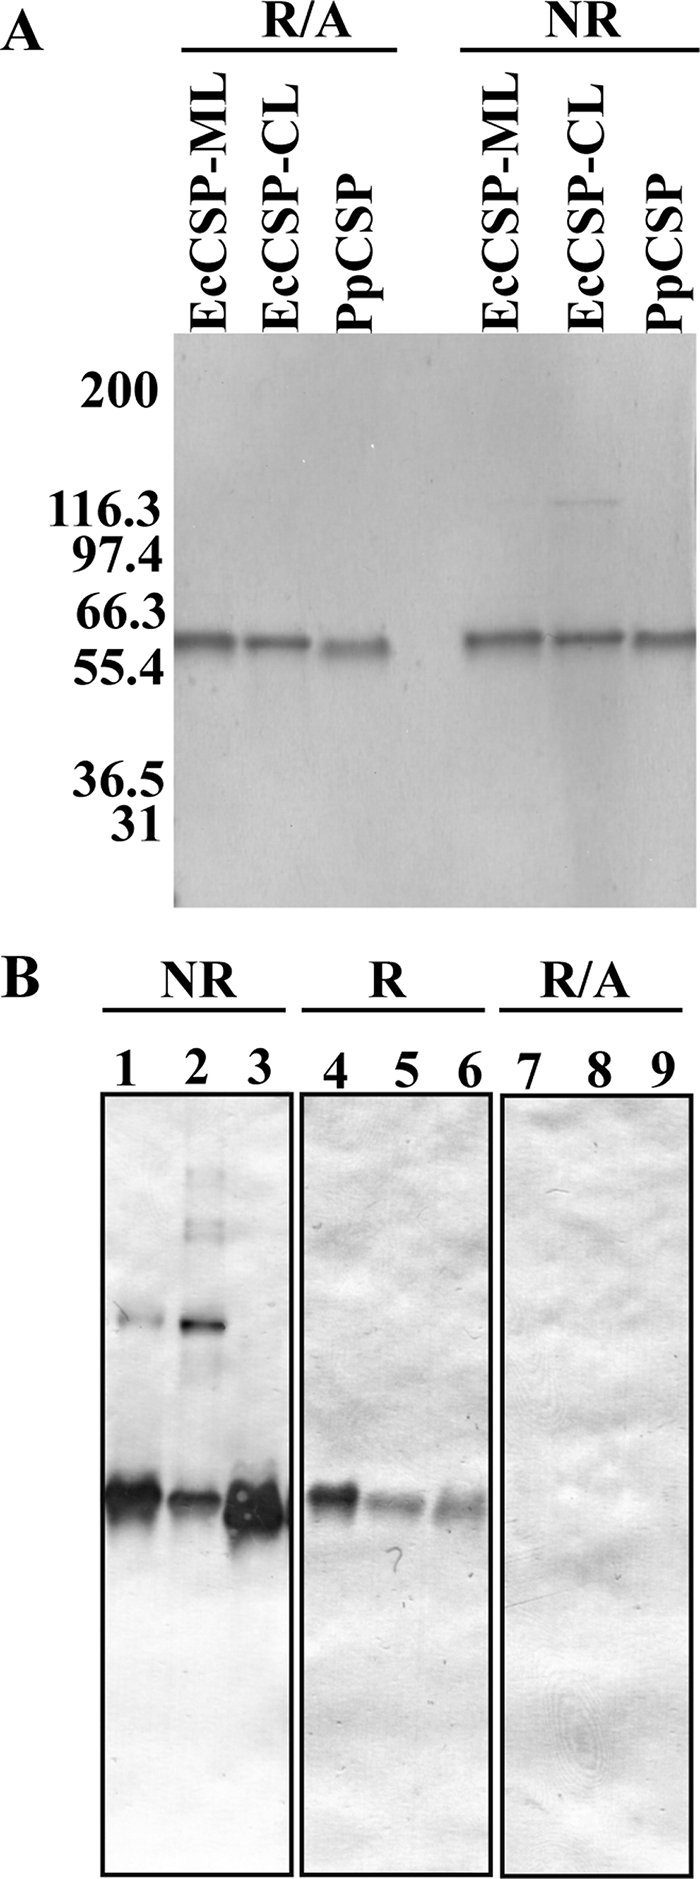
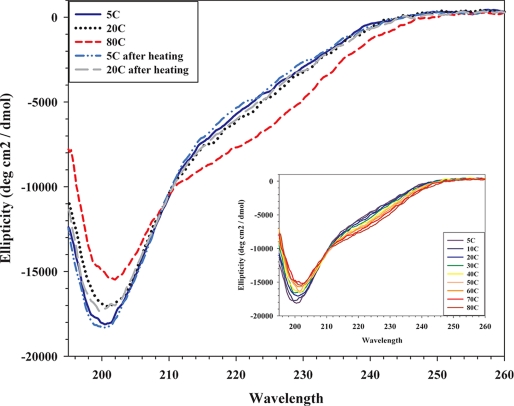
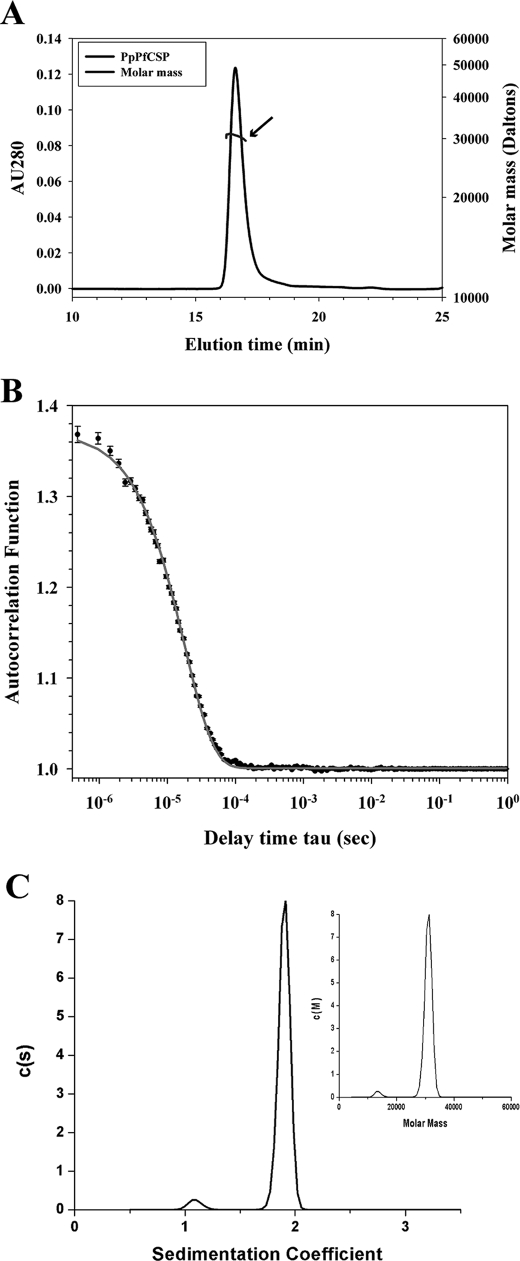
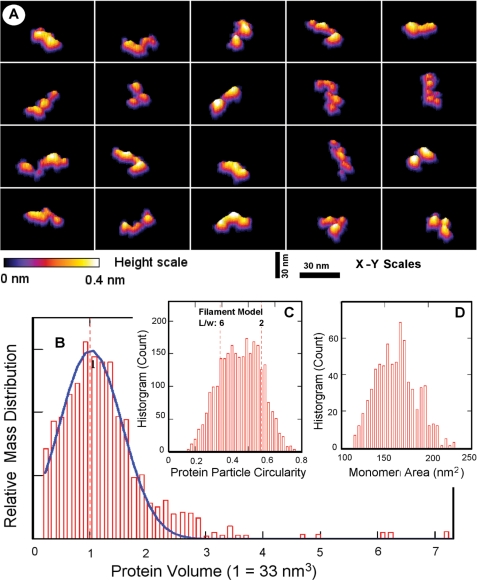
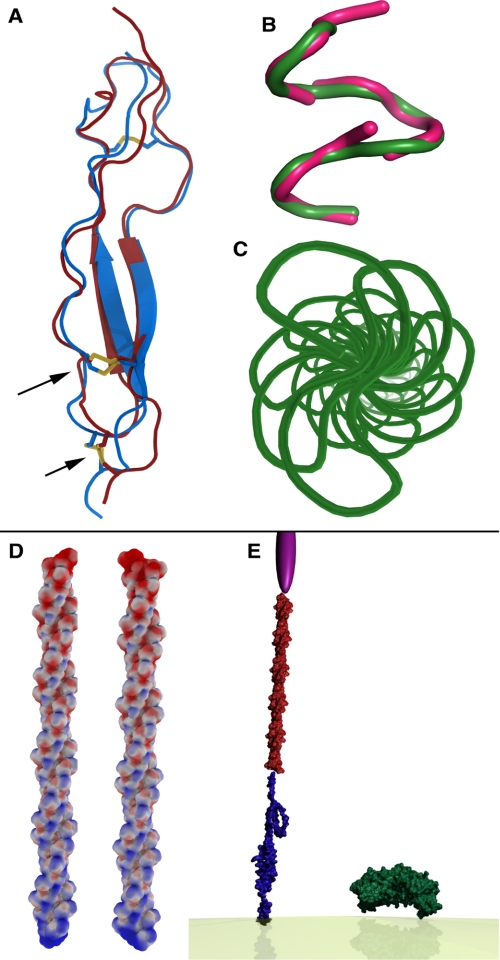
The Plasmodium falciparum circumsporozoite protein (CSP) is critical for sporozoite function and invasion of hepatocytes. Given its critical nature, a phase III human CSP malaria vaccine trial is ongoing. The CSP is composed of three regions as follows: an N terminus that binds heparin sulfate proteoglycans, a four amino acid repeat region (NANP), and a C terminus that contains a thrombospondin-like type I repeat (TSR) domain. Despite the importance of CSP, little is known about its structure. Therefore, recombinant forms of CSP were produced by expression in both Escherichia coli (Ec) and then refolded (EcCSP) or in the methylotrophic yeast Pichia pastoris (PpCSP) for structural analyses. To analyze the TSR domain of recombinant CSP, conformation-dependent monoclonal antibodies that recognized unfixed P. falciparum sporozoites and inhibited sporozoite invasion of HepG2 cells in vitro were identified. These monoclonal antibodies recognized all recombinant CSPs, indicating the recombinant CSPs contain a properly folded TSR domain structure. Characterization of both EcCSP and PpCSP by dynamic light scattering and velocity sedimentation demonstrated that both forms of CSP appeared as highly extended proteins (R(h) 4.2 and 4.58 nm, respectively). Furthermore, high resolution atomic force microscopy revealed flexible, rod-like structures with a ribbon-like appearance. Using this information, we modeled the NANP repeat and TSR domain of CSP. Consistent with the biochemical and biophysical results, the repeat region formed a rod-like structure about 21-25 nm in length and 1.5 nm in width. Thus native CSP appears as a glycosylphosphatidylinositol-anchored, flexible rod-like protein on the sporozoite surface.


Figures

FIGURE 1.
FIGURE 1.
Schematic of the E. coli and P. pastoris CSP constructs. The diagram represents the full-length CSP gene (top) and the shortened CSP amino acid sequences Leu19–Ser411 and Gly86–Ser410 corresponding to the EcCSP (middle) and PpCSP (bottom) constructs, respectively. The signal sequence, region 1, repeat region, TSR domain, and glycosylphosphatidylinositol (GPI) signal are shown. The start site for the ScCSP degradative product used to immunize mice, Ser301, as indicated under “Experimental Procedures,” is indicated by an asterisk on the diagram of the full-length CSP gene.
FIGURE 2.
FIGURE 2.
Characterization of CSP-specific mAbs. A, representative immunoblot of a sporozoite lysate reacted with three mAbs, 1G12, 4C2, and 1G2, under nonreducing (NR) and reducing + alkylated (R/A) conditions. B, confocal microscopy analysis of live sporozoites. Sporozoites were stained with the indicated monoclonal antibody at 4 °C and detected using species-specific secondary antibodies coupled with Alexa 488.
FIGURE 3.
FIGURE 3.
Biophysical and biochemical characterization of EcCSP and PpCSP by SDS-PAGE and immunoblot. A, Coomassie Blue-stained SDS-PAGE of 1 μg of purified recombinant EcCSP and PpCSP under nonreduced (NR) and reducing + alkylated (R/A) conditions. B, representative immunoblot of 0.5 μg of purified recombinant EcCSP-ML (lanes 1, 4, and 7), EcCSP-CL (lanes 2, 5, and 8), and PpCSP (lanes 3, 6, and 9) under nonreducing (lanes 1–3), reducing (lanes 4–6), and reducing + alkylated (lanes 7–9) conditions, and shown are results obtained using mAb 1G12.
FIGURE 4.
FIGURE 4.
CD analysis of PpCSP in aqueous solution. The ellipticity (degrees cm2/dmol) was plotted as a function of wavelength (nm). Raw data measured in millidegrees was converted into ellipticity (degrees cm2/dmol). Spectra were obtained at 5, 20, and 80 °C and at 5 and 20 °C following heating at 80 °C. Inset, ellipticity (degrees cm2/dmol) was plotted as a function of wavelength (nm) during heating. Spectra were obtained in 5 °C increments beginning at 5 °C; however, data are presented in 10 °C increments beginning at 5 °C.
FIGURE 5.
FIGURE 5.
Biochemical characterization of PpCSP by SEC-MALS-QELS HPLC and analytical ultracentrifugation. A, analysis of PpCSP by SEC-MALS-HPLC provided the molar mass distribution of the main peak (molar mass line indicated by arrow) compared with the absorbance at 280 nm. B, QELS goodness of fit of the autocorrelation function plot at the apex of the peak. C, sedimentation coefficient distributions and molar mass obtained from the boundary sedimentation velocity data (data not shown) of the PpCSP sample by the computational analysis described under “Experimental Procedures.” The molar mass distribution c(M) versus M shown in the inset is calculated from the c(s) versus s distribution using the fitted weight average f/f0. The differential c(s) scale is in units of absorbance per Svedberg unit, and differential c(M) scale is in units of absorbance per molar mass multiplied by 100,000.
FIGURE 6.
FIGURE 6.
AFM characterization of PpCSP deposited from PBS, pH 7.4, on Mica. A, panel of representative images, in three-dimensional plots (70 nm square viewed from the scan direction vertically, colored scale bar for height up to 0.4 nm bottom left, and 30 nm bars in the x-y representing scale), showing PpCSP protein monomer shapes as seen in AFM topographies of uniformly dispersed PpCSP particles on a mica surface. B, mass distribution histogram from ∼2600 computed particles reveals that about 92% PpCSP is seen in a monomeric state (under the blue curve centered at the monomer volume of 33 nm3). C, histogram of the circularity, defined as 4π·area/(perimeter)2, of these particles suggests flexible rod-like molecules, showing twisted ribbon-like morphologies with a typical length to width ratio between 2 and 6. D, histogram of the molecular area for 711 PpCSP monomers, having a more typical measured protein volume between 0.75 and 1.25 of the monomer value in (B) reveals a distribution range of ∼120 to 200 nm2.
FIGURE 7.
FIGURE 7.
Molecular models. A, TSR domain of CSP (Tyr319 to Ser375) was modeled by homology. Protein Data Bank entry 1lsl is shown in gray, and the model for the CSP TSR domain in green. The important disulfide bonding pattern is retained in the model (arrows). Red indicates portions of the TSR region with poorly predicted structure. B, NMR (green) and crystal (pink) structures for the NPNA repeat agree to less than 0.5 Å root mean square deviation. C, NMR structure was extended by sequential superposition of the NPNA repeats. This view is down the long axis. D, repeat region forms a long stem-like superhelix composed of regular β-turns. The electrostatic potential mapped to the solvent-accessible surface of the repeat region indicates an area of significant negative charge in the first turn of the superhelix. E, scaled graphic depiction of CSP extending from the lipid membrane relative to PfAMA1. The graphical image of PfAMA1 was generated from a composite of the structural data for PfAMAI and PvAMAI (Protein Data Bank codes 2Q8A and 2J4W, respectively). The TSR domain is represented in blue, repeat region in red, and the N terminus in purple. The N-terminal depiction has been added solely to symbolize the N-terminal space. The shape of the N terminus is a graphical illustration and is not based on structural data.

Similar articles

Cited by

References

    1. Clyde D. F., Most H., McCarthy V. C., Vanderberg J. P. (1973) Am. J. Med. Sci. 266, 169–177 - PubMed
    1. Nussenzweig R. S., Vanderberg J., Most H., Orton C. (1967) Nature 216, 160–162 - PubMed
    1. Nussenzweig R. S., Vanderberg J. P., Most H., Orton C. (1969) Nature 222, 488–489 - PubMed
    1. Franke E. D., Sette A., Sacci J., Jr., Southwood S., Corradin G., Hoffman S. L. (2000) Infect. Immun. 68, 3403–3411 - PMC - PubMed
    1. Hollingdale M. R., Zavala F., Nussenzweig R. S., Nussenzweig V. (1982) J. Immunol. 128, 1929–1930 - PubMed

Publication types

MeSH terms

LinkOut - more resources