. 2009 Aug;15(8):930-9.
doi: 10.1038/nm.2002. Epub 2009 Jul 26.

Lean, but not obese, fat is enriched for a unique population of regulatory T cells that affect metabolic parameters

Affiliations

Lean, but not obese, fat is enriched for a unique population of regulatory T cells that affect metabolic parameters

Markus Feuerer et al. Nat Med. 2009 Aug.

Abstract

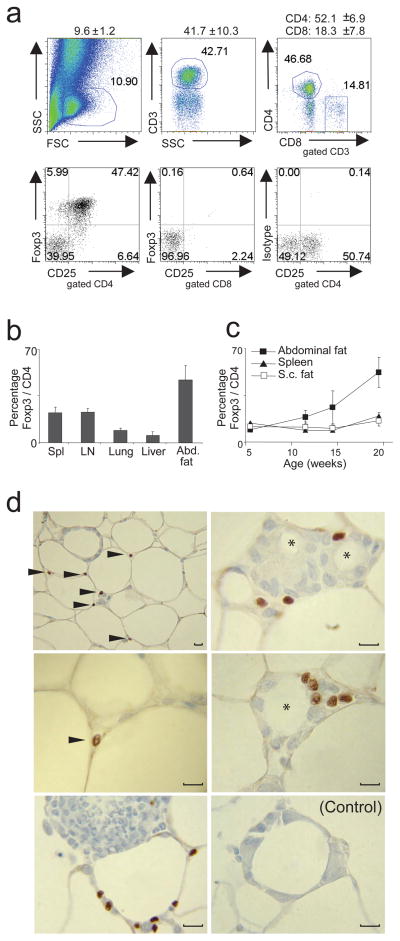
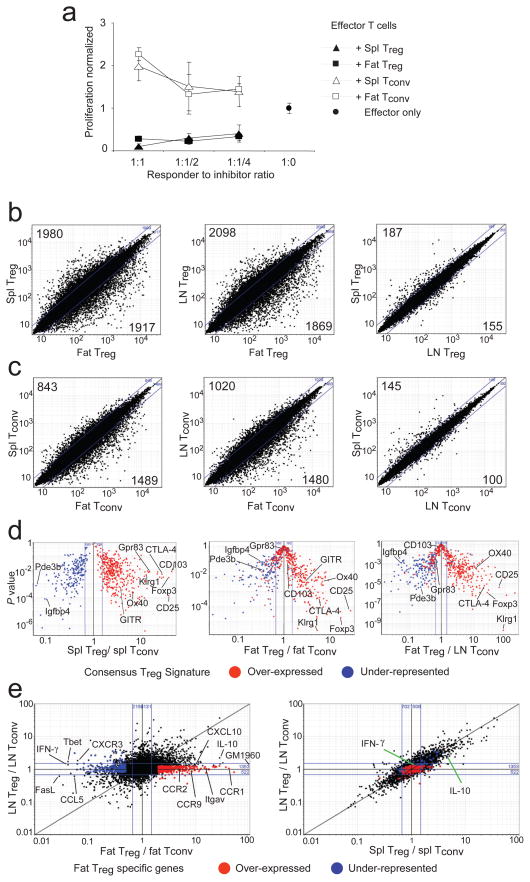
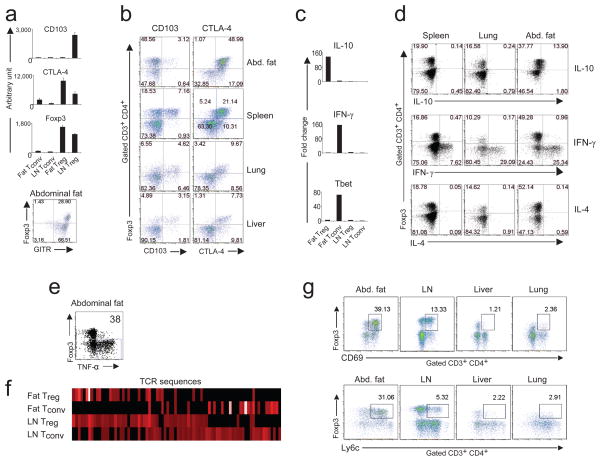
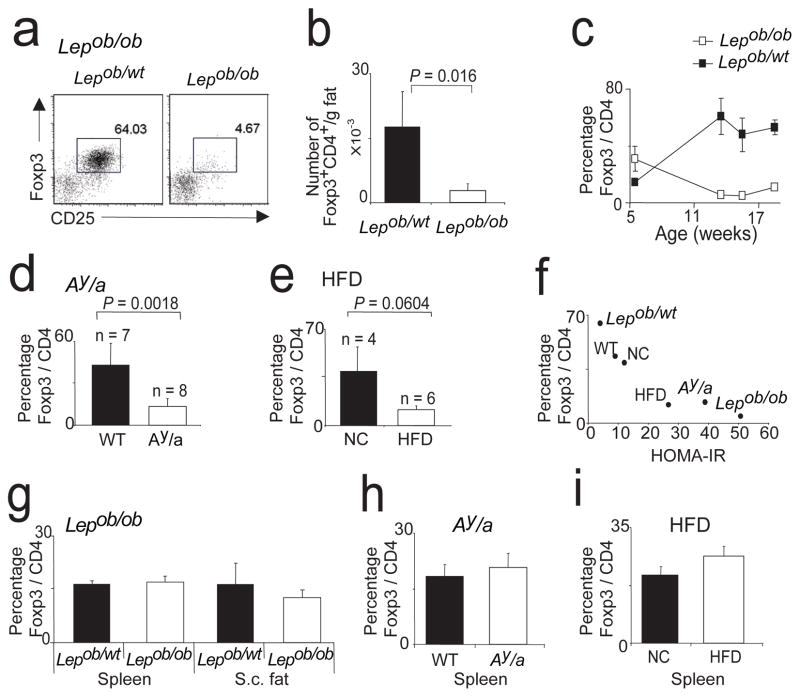
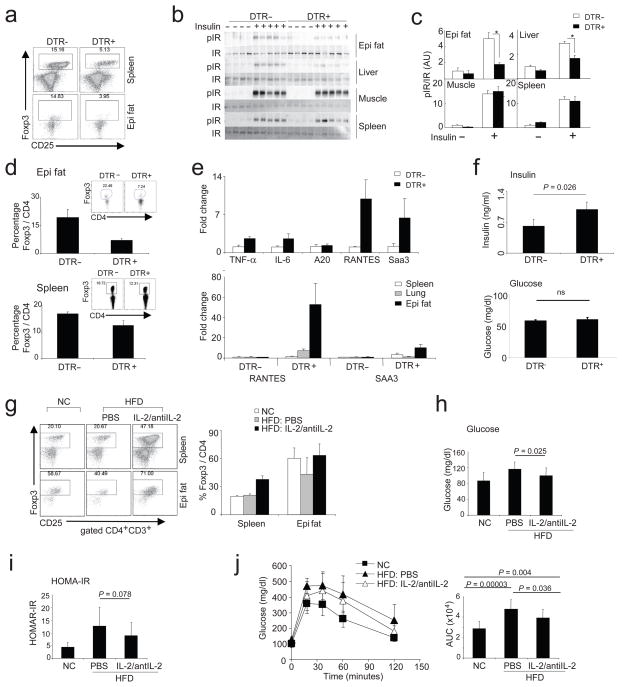
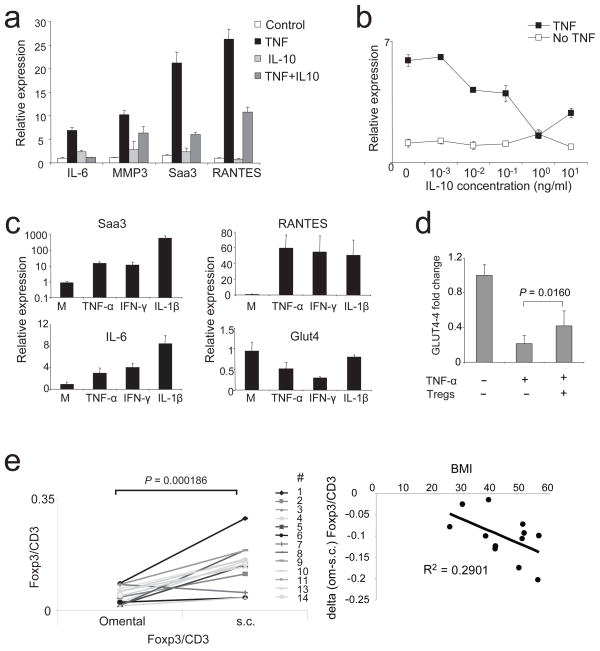
Obesity is accompanied by chronic, low-grade inflammation of adipose tissue, which promotes insulin resistance and type-2 diabetes. These findings raise the question of how fat inflammation can escape the powerful armamentarium of cells and molecules normally responsible for guarding against a runaway immune response. CD4(+) Foxp3(+) T regulatory (T(reg)) cells with a unique phenotype were highly enriched in the abdominal fat of normal mice, but their numbers were strikingly and specifically reduced at this site in insulin-resistant models of obesity. Loss-of-function and gain-of-function experiments revealed that these T(reg) cells influenced the inflammatory state of adipose tissue and, thus, insulin resistance. Cytokines differentially synthesized by fat-resident regulatory and conventional T cells directly affected the synthesis of inflammatory mediators and glucose uptake by cultured adipocytes. These observations suggest that harnessing the anti-inflammatory properties of T(reg) cells to inhibit elements of the metabolic syndrome may have therapeutic potential.


Figures

Figure 1
Figure 1
Abdominal (epidydimal) and subcutaneous (s.c.) fat pads as well as spleen, LN, lung and liver were isolated from retired-breeder B6 male mice, and the SVF fraction was stained for Foxp3, CD3, CD4, CD8 and CD25. (a) Upper panel: T cell distribution in SVF fraction from abdominal fat tissue. Numbers on top indicate the mean and standard deviation (SD) for cells in the lymphocyte gate after fixing and permeabilization, fraction of CD3+ T cells among lymphocyte-gated cells and distribution of CD4+ and CD8+ T cells. Lower panel: Percentage of Foxp3+CD25+ T cells in abdominal fat tissue gated on CD4+ or CD8+ T cells. Organs of 5 mice were pooled. Representative dot plots are shown. (b) Frequency of Foxp3+CD4+ T cells in different organs. Mean and SD from at least three independent experiments are shown, whereas organs from 4–5 mice per experiment were pooled. (c) Kinetic of Treg cell appearance in abdominal and s.c. fat tissue as well as in spleen. (d) Immunohistology of abdominal adipose tissue. Arrow-head indicates Foxp3 staining. Note: Foxp3 expression is restricted to the nucleus. * refers to dead-adipocyte residue surrounded by a crown-like structure formed by immune cells. Control staining with isotype antibody. Original magnification: left panel, upper picture 400x, all other 1000x.
Figure 2
Figure 2
Functional comparison of Treg and Tconv cells from abdominal adipose tissue, LN and spleen. CD4+CD25+ Treg and Tconv cells were isolated from retired-breeder B6 mice. (a) A standard in vitro suppression assay was performed. Spleen-derived CD4+ effector T cells (responder cells) were incubated at various ratios with different T cell populations (spl: spleen, Fat: adipose tissue derived T cells). (b–e) Analysis with Affymetrix M430v2.0 chips. Normalized expression values for profiles directly comparing Treg cells (b) between: fat vs spleen (left panel), fat vs LN (center panel), LN vs spleen (right panel). Or for profiles directly comparing Tconv (c) between: fat vs spleen (left panel), fat vs LN (center panel), LN vs spleen (right panel). (b and c) Numbers are calculated on the basis of a cut-off of 2-fold from the individual comparisons. (d) “Volcano” plots of gene-expression data comparing P-value vs. fold-change for probes from the consensus Treg signature (23, 26). Plotted for: spleen Treg vs Tconv (left panel); fat Treg vs Tconv (center panel); fat Treg vs LN Tconv (right panel). (e) Fold-change to fold-change plots comparing Treg expression profiles between: fat Treg (x-axis) and LN Treg (y-axis) (left panel); spleen Treg (x-axis) and LN Treg (y-axis) (right panel). Genes uniquely up or down regulated in fat Treg cells are highlighted in red and blue.
Figure 3
Figure 3
Phenotypic characterization of Treg cells from abdominal (epidydimal) fat tissue, spleen, lung and liver. (a and b) Cells were isolated from retired-breeder B6 mice, and the SVF fraction was stained for Foxp3, CD3, CD4, CD8, CD25, GITR, CD103 and CTLA-4. (a and c) Relative RNA expression of selected genes from Treg and Tconv cells from LN and fat. (d and e) Cytokine-expression profile from Treg and Tconv cells from spleen, lung and fat tissue. Profiles for IL-10, IFN-γ and IL-4. Representative dot plots of at least three independent experiments are shown. Organs from 4–6 mice were pooled per experiment. (f) TCR sequences of fat-derived Treg and Tconv cells. Abdominal fat and LN Treg and Tconv cells were isolated from old male animals from the Limited (LTD) mouse line. The frequency of the CDR3α sequences was analyzed on a single-cell base. Graphic display of the TCR sequences in a heat-map format from Treg and Tconv cells. (g) Cells were isolated from abdominal adipose tissue, LN, liver and lung from retired-breeder B6 mice, and the SVF fraction was stained for Foxp3, CD3, CD4, CD8, and for the activation marker CD69 and Ly6c. Representative dot plots are shown.
Figure 4
Figure 4
Three mouse models of obesity: Lepob/ob, Ay/a and HFD. (a–c) Abdominal adipose tissue from Lepob/ob and heterozygote Lepob/wt mice was analyzed for Treg cell frequency. (a) Representative dot plots of 13-week-old mice. (b) Total number of Treg cells per one gram fat. (c) Changes of Treg representation over age. Mean and SD are shown. (d) Percentage of Treg cells in abdominal adipose tissue of 24-week-old Ay/a or littermate (WT) mice. (e) Percentage of fat Treg cells in mice fed for 29 weeks with HFD or NC. (f) Correlation of HOMAR-IR and fraction of Treg cells. (g–i) Observed changes of Treg cell proportion in adipose tissue of the three obesity models were not reflected in other organs. (g) Lepob/ob, (h) Ay/a, (i) HFD.
Figure 5
Figure 5
Loss-of- and gain-of-function experiments. (a–f) Loss-of-function experiment by depleting Treg cells expressing DTR. 10-week-old male mice, either DTR-positive or -negative, were treated every other day for 4 days (a–c) or 9 days (d–f) with DT. (a) Percentage of Treg cells from spleen or the abdominal fat after 4 days of treatment. (b and c) Treg depletion affects insulin signaling in epididymal white adipose tissue (WAT) and liver. Immunoprecipitation and Western blotting of insulin-induced IR shows a decrease in IR phosphorylation (pIR) in epi WAT and liver without differences in muscle and spleen. (b) Blot data. (c) Quantification of pIR normalized by total IR. (N≥4, *p<0.004, T-test); (d) Percentage of Treg cells from the abdominal fat (upper panel) or spleen (lower panel) after 9 days of treatment, with a representative dot plot as an insert. (e) Upper panel: Expression of TNF-α, IL-6, A20, RANTES and SAA3 transcripts in abdominal adipose tissue. Three mice per group, one of two independent experiments is shown. Lower panel: comparison of RANTES and SAA3 transcripts in spleen, lung and abdominal fat (epi fat). (f) Fasting-insulin (upper panel) and -glucose levels (lower panel) after 9 days of treatment every other day. Six mice per group from two independent experiments were pooled. Significance was determined by the Mann-Whitney U test. (g–j) Gain-of-function experiment. In situ expansion of Treg cells via injection of a mAb specific for IL-2 coupled with recombinant IL-2. (g) Dot plots (left panel) and a summarizing bar graph (right panel) showing Treg cells from spleen and abdominal fat tissue (epi fat) from mice fed normal chow (NC) or with 15 weeks of HFD. Treated with IL-2/anti-IL2 complex or saline for 6 days and analyzed on day 14 (n=6 for each group). Blood glucose (h) HOMA-IR (i), and an i.p. GTT (j) of mice described in (g). (j, right panel), calculated area under the curve (AUC) from all mice tested by GTT (n=11 in each group), including the dataset described in (g). P-values were calculated with the T-test.
Figure 6
Figure 6
Cytokine effects on adipocytes and human correlates. (a and b) IL-10 can reverse TNF-α mediated inflammatory changes in differentiated adipocytes. (a) Expression of IL-6, MMP3, SAA3 and RANTES were measured with qPCR under unmanipulated culture conditions (control); adipocytes were treated with TNF-α (TNF); cells were treated IL-10 (IL-10) alone; or cells were treated with TNF-α and IL-10 (TNF+IL-10). (b) Relative expression of IL-6 in differentiated adipocytes, dose response curve of IL-10. TNF: TNF-α and different concentrations of IL-10. No TNF: only IL-10. Representative experiments are shown. (c) Expression of SAA3, RANTES, IL-6 and Glut4 in differentiated adipocytes, unmanipulated (M) or treated with TNF-α, IFN-γ and IL-1β. Representative experiments are shown. (d) Expression of Glut4 in differentiated adipocytes either unmanipulated or treated with TNF-α in presence or absence of spleen Treg cells. Mean and SD of 3 independent experiments are shown. P-value was calculated with T-test. (e) Paired human omental and s.c. adipose samples from mostly obese individuals (BMI range: 25.5–56.43, average: 44.85). Expression of FOXP3 and CD3 was measured by quantitative PCR. Plotted are the ratios of FOXP3 vs. CD3 for omental and s.c. adipose tissue (left panel). Right panel: the decrease in FOXP3/CD3 ratio in omental versus s.c. adipose tissue was plotted against the BMI for each individual donor from the left panel. Except the positive value of subject #7 (> 2 standard deviations from the mean) was not included. Each dot represents an individual donor.

Comment in

  • T-ing up inflammation in fat.
    Lumeng CN, Maillard I, Saltiel AR. Lumeng CN, et al. Nat Med. 2009 Aug;15(8):846-7. doi: 10.1038/nm0809-846. Nat Med. 2009. PMID: 19661987 No abstract available.

References

    1. Shoelson SE, Lee J, Goldfine AB. Inflammation and insulin resistance. J Clin Invest. 2006;116:1793–1801. - PMC - PubMed
    1. Hotamisligil GS, Shargill NS, Spiegelman BM. Adipose expression of tumor necrosis factor-alpha: direct role in obesity-linked insulin resistance. Science. 1993;259:87–91. - PubMed
    1. Cai D, et al. Local and systemic insulin resistance resulting from hepatic activation of IKK-beta and NF-kappaB. Nat Med. 2005;11:183–190. - PMC - PubMed
    1. Bosello O, Zamboni M. Visceral obesity and metabolic syndrome. Obes Rev. 2000;1:47–56. - PubMed
    1. Fantuzzi G. Adipose tissue, adipokines, and inflammation. J Allergy Clin Immunol. 2005;115:911–919. - PubMed

Publication types

MeSH terms

Associated data