. 2009 Aug;41(8):941-5.
doi: 10.1038/ng.409. Epub 2009 Jul 26.

H3.3/H2A.Z double variant-containing nucleosomes mark 'nucleosome-free regions' of active promoters and other regulatory regions

Affiliations

H3.3/H2A.Z double variant-containing nucleosomes mark 'nucleosome-free regions' of active promoters and other regulatory regions

Chunyuan Jin et al. Nat Genet. 2009 Aug.

Abstract

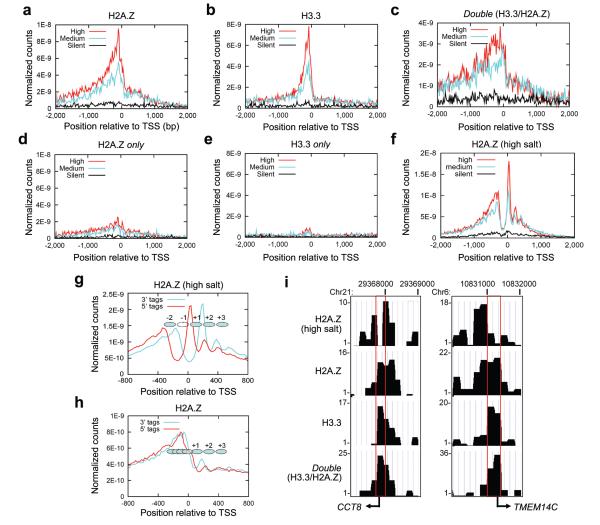
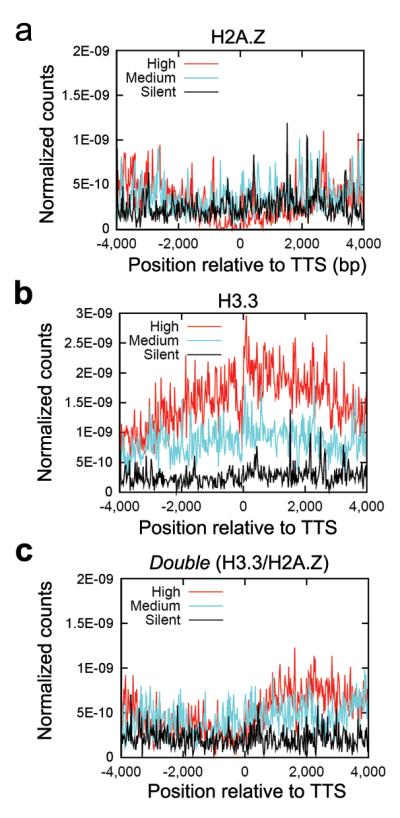
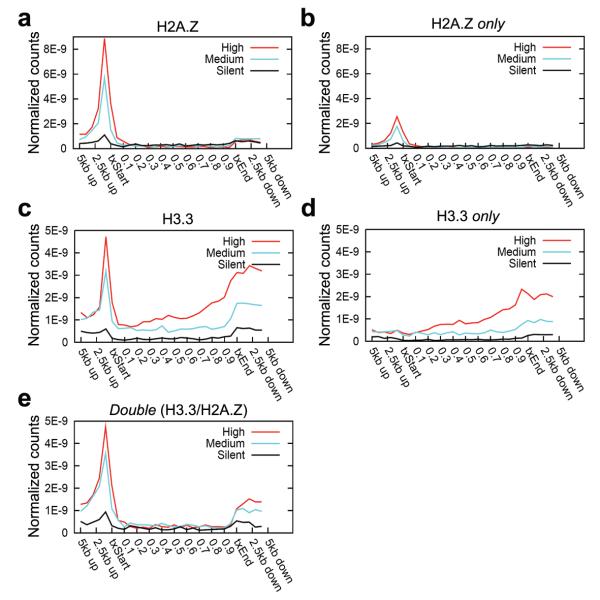
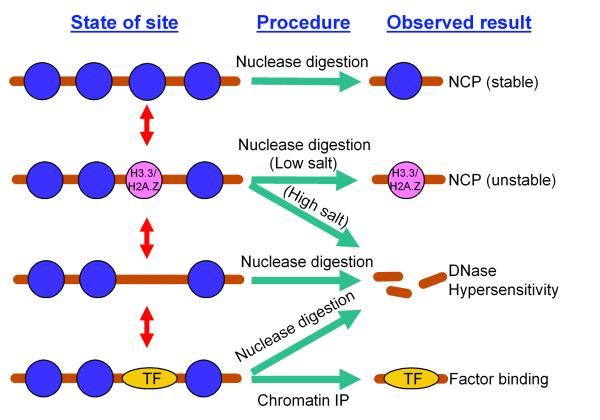
To understand how chromatin structure is organized by different histone variants, we have measured the genome-wide distribution of nucleosome core particles (NCPs) containing the histone variants H3.3 and H2A.Z in human cells. We find that a special class of NCPs containing both variants is enriched at 'nucleosome-free regions' of active promoters, enhancers and insulator regions. We show that preparative methods used previously in studying nucleosome structure result in the loss of these unstable double-variant NCPs. It seems likely that this instability facilitates the access of transcription factors to promoters and other regulatory sites in vivo. Other combinations of variants have different distributions, consistent with distinct roles for histone variants in the modulation of gene expression.


Figures

Figure 1
Figure 1
H3.3/H2A.Z NCPs mark ‘nucleosome-free regions’ of active promoters. Tags in non-overlapping 20 bp windows relative to the aligned transcription start sites (TSSs) were tallied in the gene set. The tag counts were normalized by the total numbers of bases (i.e. 20 multiplied by the number of genes in the gene set). Island-filtered 5′ tags were used in (a-f) and the profiles were further normalized by the total number of island-filtered tags in the library. All tags were used in (g,h) and the profiles were further normalized by the total number of tags in the library. (a-e) Profiles of histone variants indicated above each panel across the TSS for 1000 highly active (red), intermediately active (cyan) and silent genes (black) are shown (see Methods). (f) Profile of H2A.Z-containing NCPs isolated in high salt across the TSS for 1000 highly active (red), intermediately active (cyan) and silent genes (black) are shown. (g,h) The H2A.Z nucleosome positioning near the TSS at high (g) or low salt (h). The y axis shows the normalized counts of sequenced tags from the upper strand and the lower strand of the DNA at each position, represent 5′ and 3′ boundaries of each NCP. ‘Open oval’ represents depleted NCP; ‘filled oval’ indicates phased NCP. (i) Two typical examples of histone variants patterns at high resolution at TSSs of two active genes, shown as custom tracks on the UCSC genome browser. Both active genes CCT8 and TMEME14C have high levels of H3.3/2A.Z NCPs at the TSS (lower three panels). The loss of these NCPs after exposure to high salt (top panels) is evident (red rectangles).
Figure 2
Figure 2
H3.3/H2A.Z NCPs enriched at other regulatory elements. (a,b) Histone variants at intergenic CTCF-binding sites. Methods used here were similar to Fig 1a-f. The H2A.Z (as well as ‘H2A.Z only’) and H3.3 (as well as ‘H3.3 only’) were normalized by the total tag numbers of island-filtered tags in H2A.Z and H3.3 libraries, respectively, while the profile of Double (H3.3/H2A.Z) was normalized by total island-filtered tags in the Double library. (c,d) Averaged H2A.Z nucleosome positioning near the CTCF-binding sites at low (c) or high (d) salt shown by the sequenced 5′ (red) and 3′ (cyan) tags, representing the 5′ and 3′ boundary of each NCP. Method was similar to that described in Fig 1g,h, except the data is plotted as logarithmic curve. (e) Histone variants at ENCODE DNase I hypersensitive sites. All DNase I HS sites were aligned and normalized to the same length, and partitioned into twenty blocks. Island-filtered tags in each block were tallied and normalized by the total number of bases in each block. Outside the DNase I HS sites, island-filtered tags were tallied in 50 bp windows in the 2 kb upstream and downstream regions and normalized similarly. At the end, the profile was also normalized by the total number of island-filtered tags in each sample. (f) In HeLa cells, H3.3/H2A.Z NCPs are only enriched at HeLa DNase I hypersensitive sites (red) but not at sites (cyan) that are DNase I hypersensitive in CD4+ T cells but not in HeLa.
Figure 3
Figure 3
Histone variants near transcription termination sites (TTSs). Method was the same as used for Fig 1a-f. (a-c) Profiles of histone variants indicated above each panel across the TTS for 1000 highly active (red), intermediately active (cyan) and silent genes (black) are shown.
Figure 4
Figure 4
Different combinations of histone variants have distinctive distribution patterns across genes. (a-e) Profiles of histone variants indicated above each panel in and around gene bodies for 1000 highly active (red), intermediately active (cyan) or silent (black) genes are presented. For each gene, island-filtered tags were summed according to their shifted positions in 1 kb windows from 5 kb upstream of the transcription start site (txStart) to the txStart and from the transcription end site (txEnd) to 5 kb downstream. Within the gene bodies, island-filtered tags were summed according to their shifted positions in windows equal to 5% of the gene length. All window tag counts were normalized by the total number of bases in the windows. The profiles of H2A.Z and ‘H2A.Z only’ (H3.3 and ‘H3.3 only’) were further normalized by the total tag numbers of island-filtered tags in the H2A.Z (H3.3) library, respectively. Using the same normalization for H2A.Z and ‘H2A.Z only’ (H3.3 and ‘H3.3 only’) allows quantitative comparison of modification levels, while the profile of Double (H3.3/H2A.Z) was further normalized by total island-filtered tags in the Double library.
Figure 5
Figure 5
Schematic representation of the dynamic exchange of factors at a transcriptionally active TSS or other regulatory elements. These sites can be occupied transiently by H3/H2A-containing NCPs (blue circle), by H3.3/H2A.Z NCPs (pink circle), by transcription factors (TFs, yellow oval), or they can be free of proteins. The mechanisms of exchange among these different states are not clear. Each of these states will be detected by the assay method designed for that purpose, but over time each site will occupy all four states.

Comment in

References

    1. Mito Y, Henikoff JG, Henikoff S. Genome-scale profiling of histone H3.3 replacement patterns. Nat Genet. 2005;37:1090–7. - PubMed
    1. Mito Y, Henikoff JG, Henikoff S. Histone replacement marks the boundaries of cis-regulatory domains. Science. 2007;315:1408–11. - PubMed
    1. Albert I, et al. Translational and rotational settings of H2A.Z nucleosomes across the Saccharomyces cerevisiae genome. Nature. 2007;446:572–6. - PubMed
    1. Barski A, et al. High-resolution profiling of histone methylations in the human genome. Cell. 2007;129:823–37. - PubMed
    1. Creyghton MP, et al. H2AZ is enriched at polycomb complex target genes in ES cells and is necessary for lineage commitment. Cell. 2008;135:649–61. - PMC - PubMed

Publication types