. 2009 Oct 8;28(40):3513-25.
doi: 10.1038/onc.2009.220. Epub 2009 Jul 27.

Sonic hedgehog paracrine signaling regulates metastasis and lymphangiogenesis in pancreatic cancer

Affiliations

Sonic hedgehog paracrine signaling regulates metastasis and lymphangiogenesis in pancreatic cancer

J M Bailey et al. Oncogene. .

Abstract

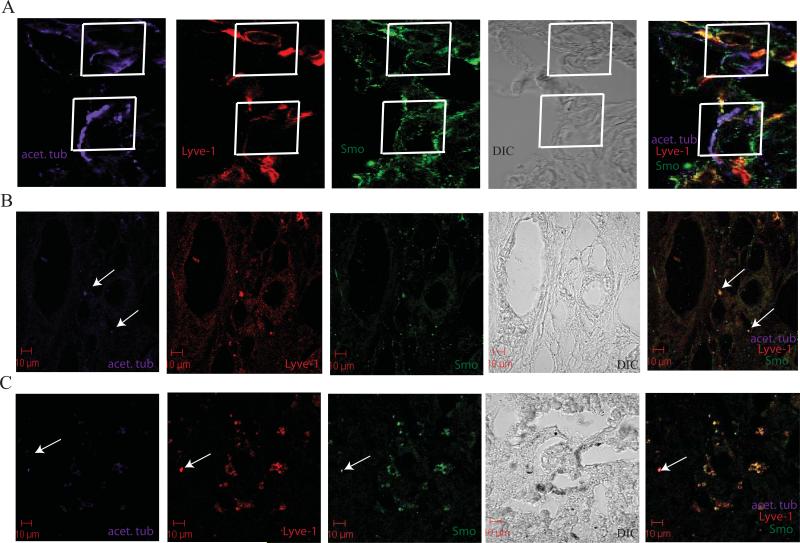
Sonic hedgehog (SHH) expression is tightly regulated throughout development. In the adult, aberrant expression of SHH is associated with the onset and progression of pancreatic cancer, as evidenced by increased levels of expression in premalignant and malignant lesions of the pancreas. We investigated the hypothesis that SHH, secreted from pancreatic tumors, functions in a paracrine manner to influence the biological condition of mesenchymal and endothelial cells. Orthotopic implantation of a pancreatic tumor cell line expressing SHH (Capan-2) and a transformed primary cell line that overexpresses SHH (T-HPNE.SHH) were used to show that overexpression of SHH increased primary tumor size and metastasis. Treatment with a neutralizing antibody, 5E1, decreased primary tumor volume and inhibited metastasis. Lyve-1+ vessels and stromal fibroblasts in tumors expressed primary cilium and showed localization of the receptor Smoothened to the primary cilium, providing evidence of active SHH signaling through this pathway. Although primary cilia are present on normal ductal cells of the pancreas, we did not observe primary cilium on the ductal tumor cells, suggesting decreased autocrine signaling through pathways mediated by the primary cilium in pancreatic cancer. These data support the hypothesis that SHH, secreted from pancreatic epithelia, is critical in establishing and regulating the tumor microenvironment and thereby contributes to progression of pancreatic cancer.


Figures

Figure 1
Figure 1. SHH decreased time-to-tumor progression and promoted tumor growth and metastasis in subcutaneous and orthotopic models of pancreatic cancer
A. Subcutaneous tumor growth properties in nude mice. Kaplan-Meier plot of time to tumor progression, as evidenced by % disease-free mice over time (n=5 for both groups, representative of 3 independent experiments). SHH overexpression in the T-HPNE cell line significantly decreased the time to tumor progression with an average time-to-tumor progression of 11 days in the T-HPNE+SHH cell line and an average time-to-tumor progression of 27 days with the T-HPNE cell line (**p= 0.001). Estimates of time to tumor formation were analyzed using the log-rank test. B. Tumor growth rates. Graphical representation of tumor growth rate (volume, n=5 for both groups, representative of 3 independent experiments). Values are given in cm3. Once tumors appeared, there were no significant differences in growth rate between transformed T-HPNE cell lines with and without SHH. C. Western blot confirmation of expression of mature SHH in orthotopic T-HPNE tumors. D. SHH significantly increased primary tumor weight in orthotopic tumors harvested at 46 days post tumor challenge (lower panel) (*p< 0.01). Bar graphs represent mean primary tumor weights (mean ± SD) (n=13). E. SHH increased metastasis to the spleen, peritoneum (*p< 0.01) and liver in an orthotopic model of pancreatic cancer at 46 days post-tumor challenge. Bar graphs represent quantitative analysis of number of mice with metastatic lesions detected in the spleen, peritoneum or liver, total mice per group = 13. F. Immunohistochemical analysis with anti-CD31 staining (brown stain) demonstrates that T-HPNE.SHH tumors have increased vascularity as compared to T.HPNE orthotopic tumors. Analysis shown at 100x magnification.
Figure 2
Figure 2. Co-injection of T-HPNE.SHH cells with pancreatic fibroblasts increases tumorigenesis and angiogenesis in vivo
A. Subcutaneous tumor growth properties in nude mice using co-cultures. Kaplan-Meier plot of time to tumor progression, as evidenced by % disease-free mice over time (n=5 for both groups, representative of 2 independent experiments). T-HPNE.SHH cells co-injected with pancreatic fibroblasts significantly decreased the time to tumor progression with an average tumor-to-tumor progression of 9 days for the T-HPNE.SHH cell line with fibroblasts compared to an average time-to-tumor progression of 12 days with the T-HPNE.SHH cell line (**p= 0.01). There was no difference observed in time-to-tumor progression between the T-HPNE cell line and the T-HPNE cell line co-cultured with pancreatic fibroblasts. Statistical analysis of time to tumor formation by the log-rank test. B. H&E analysis of the subcutaneous tumors showing an increase in density of blood vessels (vessels containing red blood cells in this image) when the T-HPNE.SHH cells were co-injected with pancreatic fibroblasts (n=2 analyzed per group). C. Graphical representation of morphometric analysis of the number of blood vessels per tumor section in the T-HPNE.SHH tumor and the T-HPNE.SHH tumor co-cultured with pancreatic fibroblasts. The tumors derived from the co-culture had increased angiogenesis when compared to the T-HPNE.SHH tumors.
Figure 3
Figure 3. Stromal cells express primary cilia
A. Confocal immunofluorescence analysis of a normal mouse pancreas. Acetylated α tubulin (acet. tub.) was used to identify primary cilia (purple). SMO expression is in green. Overlay with DIC shows expression of the primary cilia on normal ductal cells of the pancreas. SMO is expressed at low levels in both acinar and ductal cells. B. Confocal immunofluorescence analysis of a primary tumor from a patient with pancreatic cancer. SHH staining is shown in red. DIC overlay confirms SHH expression in adenocarcinoma cells and the presence of cilia in the stroma (note white arrows). C. Immunofluorescence staining of acet. tub. (grey) and SMO (green) in a serial section of the tumor analyzed in panel B. Overlay confirms localization of SMO on primary cilia in stromal cells (white arrows). D. Confocal immunofluorescence analysis of acet. tub. (purple), SHH (red) and SMO (green) in a liver metastasis from a patient with pancreatic cancer. Overlay shows primary cilia are localized to the stromal cells (white arrows). Stromal cells also show increased expression of SMO. *Analysis shown in this figure reflects staining patterns observed in 4 different patients.
Figure 4
Figure 4. Downstream pathways activated in SHH stimulated pancreatic fibroblasts
A. Immunohistochemistry on orthotopic tumor sections derived from the T-HPNE.SHH cell line. Tumor-associated fibroblasts expressing SMA show expression of Gli1, VEGF and HIF1α. B. Immunohistochemistry on orthotopic tumor sections derived from the T-HPNE.SHH cell line. SMA+ fibroblasts, along with CD31+ endothelial cells express VEGF. C. Western blot analysis of Patched and Gli3 expression by pancreatic fibroblasts in culture. Stimulation with recombinant SHH increased Patched and Gli3 expression, indicating direct SHH pathway activation in the fibroblasts. Western blot analysis of whole cell lysates from recombinant SHH stimulated pancreatic fibroblasts, which express higher levels of VEGF in response to SHH. D. Western blot analysis of recombinant SHH-stimulated pancreatic fibroblasts showing increased stabilization of HIF1α under normoxic conditions when stimulated with SHH. The fibroblasts were stimulated with increasing concentrations of SHH and were also stimulated with MG132 for 2 hours prior to cell lysate extraction. The HIF1α band identified by western blotting at 80kD was the same size as the band identified following treatment with CoCl2. E. Western blot analysis showing that stimulation with recombinant SHH increases the expression of MMP 9 in pancreatic fibroblasts.
Figure 5
Figure 5. An SHH-neutralizing antibody decreases tumor growth, metastasis and lymphangiogeneis in an orthoptopic model of pancreatic cancer
A. Graphical representation of primary tumor volume (cm3) in mice with Capan-2 orthotopic tumors. Average volumes are shown for untreated mice (n=15), mice that were administered an isotype control antibody (4E11) (n=5), and mice administered the SHH-neutralizing antibody, 5E1 (n=15). B. Graphical representation of the number of mice with metastasis to different organ sites. The untreated and 5E1-treated mice were compared (n=15 each). C. Morphometric quantification of the number of caspase 3+ cells per tumor volume in the untreated vs. 5E1-treated mice with Capan-2 tumors (n=2 per group). D and E. 5E1 treated Capan-2 cells do not show evidence of apoptosis in serum containing media (D) or serum free (E) media. Quantification of Annexin V and caspase-3 staining by flow cytometry. F. Treatment of Capan-2 cells in vitro with 5E1 does not affect proliferation rate. Graphical representation of results of MTT assays following treatment of cultures with 5E1 (anti-SHH) or control antibodies.
Figure 6
Figure 6. SHH paracrine signaling regulates lymphangiogenesis in pancreatic cancer
A. Confocal immunofluorescence analysis for the lymphatic marker, Podoplanin (green) and human ribonuclear protein staning (blue) to identify the Capan-2 tumor. B. IHC analysis for the lymphatic marker, Lyve-1 (brown stain) in the orthotopic tumors derived from mice with either no treatment or 5E1-treatment. C. Graphical representation of the number of Lyve-1+ vessels counted from the IHC in panel B. Treatment with 5E1 significantly decreased the number of Lyve-1+ vessels in the tumor sections (n=7 per group). Treatment with 5E1 significantly decreased the number of Lyve-1+ vessels (*p=0.01). D. In vitro angiogenesis assay using the HMVEC cell line. Stimulation with recombinant SHH enhanced tube formation on matrigel. SHH enhanced the rate of endothelial cell alignment (score of 1), endothelial cell sprouting (score of 3), and the formation of complex mesh-like polygon structures in vitro (score of 5). Treatment with 5E1 reversed the affects of SHH. E. Stimulation with recombinant SHH significantly increased the motility of HMVECs in vitro using transwell migration assays when stimulated with 10μg/ml rhSHH (*p=0.01).
Figure 7
Figure 7. Primary cilia expressed on Lyve-1+ cells
A. Confocal analysis of acet. tub. (purple), Lyve-1 (red) and SMO (green) in a Capan-2 orthotopic tumor. Overlay of acet. tub. and SMO is shown on two independent Lyve-1+ cells identified in the stroma of the orthotopic tumor (white boxes). B. Confocal analysis of acet. tub. (purple), Lyve-1 (red) and SMO (green) in a primary tumor section. Lyve-1+ vessels are expressing primary cilia and SMO is localized to the base of the cilia in identified vessels (white arrows). C. Confocal analysis of acet. tub. (purple), Lyve-1 (red) and SMO (green) in a liver metastasis. Lyve-1+ cells are expressing primary cilia and SMO is localized to the base of the cilia in identified vessels (white arrow).

References

    1. Apelqvist A, Ahlgren U, Edlund H. Sonic hedgehog directs specialised mesoderm differentiation in the intestine and pancreas. Curr Biol. 1997;7:801–4. - PubMed
    1. Bailey JM, Swanson BJ, Hamada T, Eggers JP, Singh PK, Caffery T, et al. Sonic hedgehog promotes desmoplasia in pancreatic cancer. Clin Cancer Res. 2008;14:5995–6004. - PMC - PubMed
    1. Cano DA, Murcia NS, Pazour GJ, Hebrok M. Orpk mouse model of polycystic kidney disease reveals essential role of primary cilia in pancreatic tissue organization. Development. 2004;131:3457–67. - PubMed
    1. Cano DA, Sekine S, Hebrok M. Primary cilia deletion in pancreatic epithelial cells results in cyst formation and pancreatitis. Gastroenterology. 2006;131:1856–69. - PubMed
    1. Corbit KC, Aanstad P, Singla V, Norman AR, Stainier DY, Reiter JF. Vertebrate Smoothened functions at the primary cilium. Nature. 2005;437:1018–21. - PubMed

Publication types