. 2009 Jul 27;4(7):e6326.
doi: 10.1371/journal.pone.0006326.

Resolving cell population heterogeneity: real-time PCR for simultaneous multiplexed gene detection in multiple single-cell samples

Affiliations

Resolving cell population heterogeneity: real-time PCR for simultaneous multiplexed gene detection in multiple single-cell samples

Alan Diercks et al. PLoS One. .

Abstract

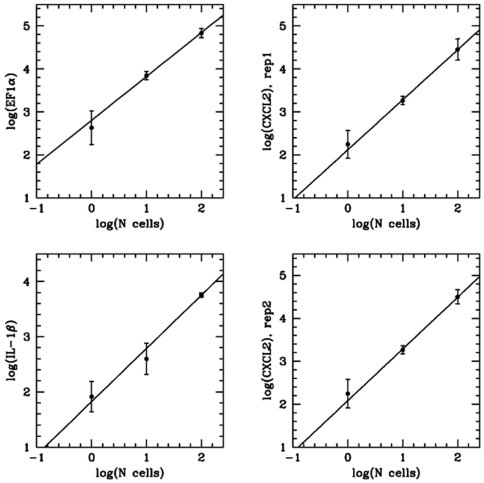
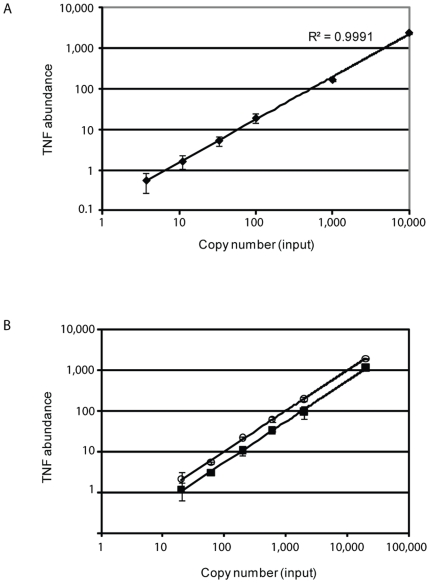
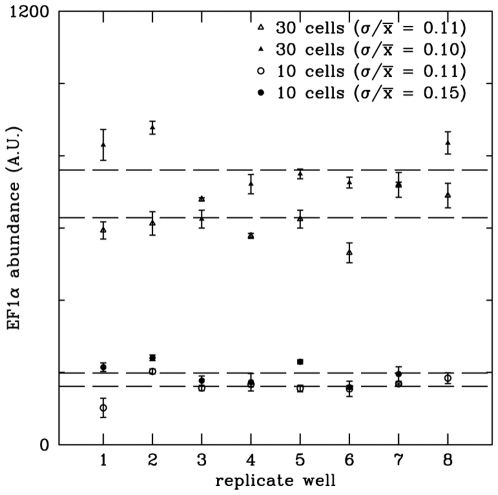
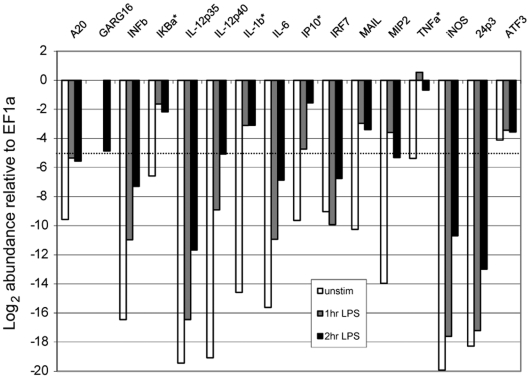
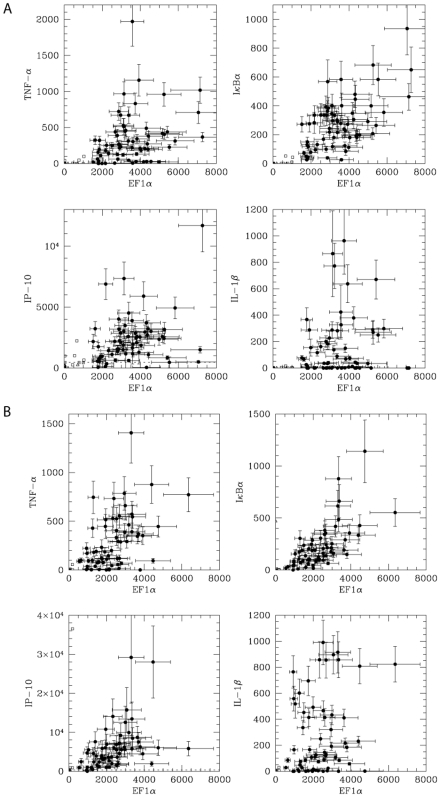
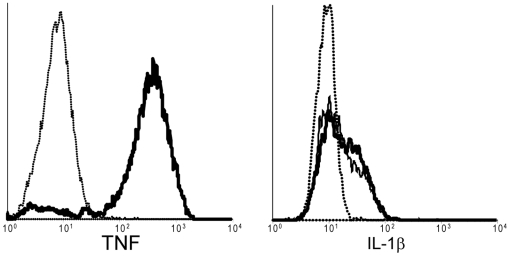
Decoding the complexity of multicellular organisms requires analytical procedures to overcome the limitations of averaged measurements of cell populations, which obscure inherent cell-cell heterogeneity and restrict the ability to distinguish between the responses of individual cells within a sample. For example, defining the timing, magnitude and the coordination of cytokine responses in single cells is critical for understanding the development of effective immunity. While approaches to measure gene expression from single cells have been reported, the absolute performance of these techniques has been difficult to assess, which likely has limited their wider application. We describe a straightforward method for simultaneously measuring the expression of multiple genes in a multitude of single-cell samples using flow cytometry, parallel cDNA synthesis, and quantification by real-time PCR. We thoroughly assess the performance of the technique using mRNA and DNA standards and cell samples, and demonstrate a detection sensitivity of approximately 30 mRNA molecules per cell, and a fractional error of 15%. Using this method, we expose unexpected heterogeneity in the expression of 5 immune-related genes in sets of single macrophages activated by different microbial stimuli. Further, our analyses reveal that the expression of one 'pro-inflammatory' cytokine is not predictive of the expression of another 'pro-inflammatory' cytokine within the same cell. These findings demonstrate that single-cell approaches are essential for studying coordinated gene expression in cell populations, and this generic and easy-to-use quantitative method is applicable in other areas in biology aimed at understanding the regulation of cellular responses.


Conflict of interest statement

Competing Interests: The authors have declared that no competing interests exist.

Figures

Figure 1
Figure 1. Sensitivity for single-cell mRNA measurements.
Macrophages were activated with the bacterial stimulus, lipopolysaccharide (30 ng/ml for 2 hours), and the indicated number of cells (1, 10 or 100 cells) were sorted by flow cytometry. mRNA expression of the indicated genes was measured by real-time PCR using 1/8th of the sample cDNA lysate per measurement. The mean and standard deviation of 12 samples are presented for each of the indicated number of cells. The Ct values were arbitrarily scaled to log10 values (y-axis).
Figure 2
Figure 2. Sensitivity of detecting numbers of DNA and RNA molecules.
Real-time PCR was performed over a concentration range from A) TNF DNA standard template or B) TNF mRNA standard template. cDNA synthesis was performed on the dilution series of mRNA samples and the difference in signal between the same amount of input mRNA (▪) versus input DNA (ο) indicates a reverse transcription efficiency of 54% in this experiment. For each copy number, the mean and standard deviation are shown for 12 samples in A) and 4 samples in B). The Y-axis is a log10 rescaling of the Ct values.
Figure 3
Figure 3. Precision of replicate real-time processing of single cells.
Two sets of either 10 or 30 cell-samples were sorted by flow cytometry, lysed and then aliquoted into 8 aliquots. cDNA synthesis was performed independently for each aliquot and EF1α expression was measured by real-time PCR in triplicate on each aliquot. The replicates of each set of samples are shown (1.3-cell equivalents, open and filled triangles; 3.8-cell equivalents, open and filled circles). Based on this and similar experiments, we conservatively assign a fractional error of 15% to the cDNA synthesis step of our process.
Figure 4
Figure 4. Relative abundance of immune genes in resting and activated macrophages.
cDNA synthesis was performed from resting (open bar) and LPS-stimulated (1 hr, grey bar, or 2 hour, black bar) bone marrow macrophages (2.1×10⁶ cells). The indicated genes were detected by real-time PCR and their abundance (Ct, mean of duplicates) is plotted relative to the EF1α signal (EF1α Ct: Unstimulated = 18.54; LPS 1 Hour = 18.19; LPS 2 hours = 18.76). We estimate that we are able to detect gene expression within a Ct of 5 of EF1α signal (dotted line). An asterisk indicates the genes that were further investigated in single cells in the experiment shown in Figure 5.
Figure 5
Figure 5. Simultaneous measurement of the expression of five genes in single macrophages.
BMDMs were stimulated with A) poly I∶C or B) LPS for 2 hours and 84 single cells (together with 12 no-cell controls) from each experiment were sorted into a microtiter plate for cDNA synthesis. mRNA standards for each gene were used to calculate absolute expression values. In each panel, the abundance of EF1α is plotted on the X-axis, and the abundance of one of the other genes is shown on the Y-axis. This presentation permits the same cell to be identified in each panel, based on its level of expression of EF1α (position on X-axis). Negative controls include blank wells (no cell sorted, open triangles) and misses (open squares). A missed sample is defined as having an EF1α abundance <2x the highest value in “blank” wells. The detection limit for IP-10 (taken as 2x the highest value measured in “blank” wells) is indicated with a dashed line.
Figure 6
Figure 6. Distribution of cytokine protein expression in single cells.
BMDMs were not stimulated (dotted line) or stimulated with for 4 hours in the presence of brefeldin A. The abundance of TNF and IL1β were detected by 2-color immunofluorescence and flow cytometry. The histogram shows the distribution of expression of the indicated cytokines in unstimulated cells (dotted line) and LPS (thick solid line) and poly I∶C (thin solid line) stimulated cells.

References

    1. Ramsey S, Ozinsky A, Clark A, Smith KD, de Atauri P, et al. Transcriptional noise and cellular heterogeneity in mammalian macrophages. Philos Trans R Soc Lond B Biol Sci. 2006;361:495–506. - PMC - PubMed
    1. Bar-Even A, Paulsson J, Maheshri N, Carmi M, O'Shea E, et al. Noise in protein expression scales with natural protein abundance. Nat Genet. 2006;38:636–643. - PubMed
    1. Colman-Lerner A, Gordon A, Serra E, Chin T, Resnekov O, et al. Regulated cell-to-cell variation in a cell-fate decision system. Nature. 2005;437:699–706. - PubMed
    1. Elowitz MB, Levine AJ, Siggia ED, Swain PS. Stochastic gene expression in a single cell. Science. 2002;297:1183–1186. - PubMed
    1. Newman JR, Ghaemmaghami S, Ihmels J, Breslow DK, Noble M, et al. Single-cell proteomic analysis of S. cerevisiae reveals the architecture of biological noise. Nature. 2006;441:840–846. - PubMed

Publication types