. 2009 Jul 27;4(7):e6372.
doi: 10.1371/journal.pone.0006372.

A method for studying protistan diversity using massively parallel sequencing of V9 hypervariable regions of small-subunit ribosomal RNA genes

Affiliations

A method for studying protistan diversity using massively parallel sequencing of V9 hypervariable regions of small-subunit ribosomal RNA genes

Linda A Amaral-Zettler et al. PLoS One. .

Erratum in

  • PLoS One. 2009;4(12). doi: 10.1371/annotation/50c43133-0df5-4b8b-8975-8cc37d4f2f26

Abstract

Background: Massively parallel pyrosequencing of amplicons from the V6 hypervariable regions of small-subunit (SSU) ribosomal RNA (rRNA) genes is commonly used to assess diversity and richness in bacterial and archaeal populations. Recent advances in pyrosequencing technology provide read lengths of up to 240 nucleotides. Amplicon pyrosequencing can now be applied to longer variable regions of the SSU rRNA gene including the V9 region in eukaryotes.

Methodology/principal findings: We present a protocol for the amplicon pyrosequencing of V9 regions for eukaryotic environmental samples for biodiversity inventories and species richness estimation. The International Census of Marine Microbes (ICoMM) and the Microbial Inventory Research Across Diverse Aquatic Long Term Ecological Research Sites (MIRADA-LTERs) projects are already employing this protocol for tag sequencing of eukaryotic samples in a wide diversity of both marine and freshwater environments.

Conclusions/significance: Massively parallel pyrosequencing of eukaryotic V9 hypervariable regions of SSU rRNA genes provides a means of estimating species richness from deeply-sampled populations and for discovering novel species from the environment.


Conflict of interest statement

Competing Interests: The authors have declared that no competing interests exist.

Figures

Figure 1
Figure 1. Station 7 sampling point on Mount Hope Bay, Somerset, Massachusetts.
The green dot on the chart depicts the location of the sampling station in the estuary where we collected the MHB sample. This station is the last one on a transect pointing away from the Brayton Point Power Plant, a once-through cooled power plant that emits thermal effluent into the bay. Surface samples were collected with a bucket by hand off the shore of Common Fence Point shown in the inset picture.
Figure 2
Figure 2. Palmer Station Long Term Ecological Research Site sampling stations included in this study.
The chart on the left depicts the Palmer LTER sampling grid along the west Antarctic Peninsula. The chart on the right is a blow-up of the sampling grid showing the locations of our 4 sampling sites as white circles. Samples were collected at approximately 10 meters and 100 meters depth from the four (north-south, inshore-offshore) corners of the sampling grid. The shading indicates bottom depth. The inset picture shows Palmer Station.
Figure 3
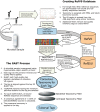
Figure 3. The Eukaryotic V9 Tag Sequencing Pipeline.
DNA sequence tag data resulting from the 454 massively parallel pyrosequencing are first trimmed of primers and quality filtered to remove low quality reads. DNA sequence tags are then subjected to a search against a reference database of full-length SSU rRNA gene sequences and further aligned against the top 50 best matching sequences. The distance from these top hits is used to produce a Global Alignment for Sequence Taxonomy (GAST) and to retrieve taxonomic assignments for the tags based on a 66% majority consensus of the GAST hits. Once taxonomy is assigned, any bacterial or archaeal sequences that were amplified in the process are removed leaving eukaryotic sequences available for further analysis. The GAST process and Reference V9 database creation are further explained in the figure.
Figure 4
Figure 4. Length variation in eukaryotic SSU rRNA gene V9 hypervariable regions.
A graph showing the length in nucleotides of the V9 region of available sequences in our RefV9 database.
Figure 5
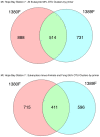
Figure 5. Venn diagrams for overlap between Mount Hope Bay OTUs recovered from 1380F/1510R versus 1389F/1510R priming combinations for all eukaryotic versus just protistan OTUs.
The upper set of Venn diagrams shows the overlap in all eukaryotic OTUs (inclusive of Animals and Fungi) calculated at the 95% cut-off level for 1380 versus 1389 forward primed reactions. The number of OTUs shared by the datasets was 514, while 888 were only recovered with the 1380F primer and 731 were unique to the 1389F primed reactions. The lower set of diagrams shows that 411 OTUs were shared by the separately primed 1380 and 1389 forward primed reactions for protistan associated OTUs (eukaryotic OTUs with animal and fungal OTUs removed) while 715 and 596 were unique to 1380F and 1389F primed reactions respectively.
Figure 6
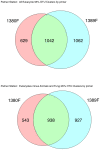
Figure 6. Venn diagrams for overlap between Palmer Station LTER OTUs recovered from 1380F/1510R versus 1389F/1510R priming combinations for all eukaryotic versus just protistan OTUs.
The upper set of Venn diagrams shows the overlap in all eukaryotic OTUs (inclusive of Animals and Fungi) calculated at the 95% cut-off level for 1380 versus 1389 forward primed reactions. The number of OTUs shared by the datasets was 1042, while 629 were only recovered with the 1380F primer and 1062 were unique to the 1389F primed reactions. The lower set of diagrams shows that 938 OTUs were shared by the separately primed 1380 and 1389 forward primed reactions for protistan associated OTUs (eukaryotic OTUs with animal and fungal OTUs removed) while 543 and 927 were unique to 1380F and 1389F primed reactions respectively.
Figure 7
Figure 7. Percent cumulative reads versus GAST distance for PAL LTER versus MHB total eukaryotic tags.
A graph showing the percentage of eukaryotic reads and their corresponding GAST distances from the top hits in the RefV9 database. The blue line shows Palmer Station LTER data while the red line shows data from Mount Hope Bay Station 7. From the graph we see that approximately 29% of the PAL eukaryotic tags and 24% of the MHB eukaryotic tags had GAST distances greater than 0.10 from sequences in our RefV9 database.

Similar articles

Cited by

References

    1. Amaral-Zettler L, Peplies J, Ramette A, Fuchs B, Ludwig W, et al. Proceedings of the international workshop on Ribosomal RNA technology, April 7–9, 2008, Bremen, Germany. Syst and Appl Microbiol. 2008;31:258–268. - PubMed
    1. Olsen GJ, Lane DJ, Giovannoni SJ, Pace NR. Microbial ecology and evolution: a ribosomal RNA approach. Annu Rev Microbiol. 1986;40:337–365. - PubMed
    1. Pace NR, Stahl DA, Lane DJ, Olsen GJ. Analyzing natural microbial populations by rRNA sequences. ASM News. 1985;51:4–12.
    1. Sogin ML, Morrison HG, Huber JA, Welch DM, Huse SM, et al. Microbial diversity in the deep sea and the underexplored, “rare biosphere”. Proc Nat Acad Sci. 2006;103:12115–12120. - PMC - PubMed
    1. Kysela DT, Palacios C, Sogin ML. Serial Analysis of V6-ribosomal sequence tags (SARST-V6): A method for efficient, high-throughput analysis of microbial community composition. Environ Microbiol. 2005;7:356–364. - PubMed

Publication types