

Optimal phase for coronary interpretations and correlation of ejection fraction using late-diastole and end-diastole imaging in cardiac computed tomography angiography: implications for prospective triggering
- PMID: 19633922
- PMCID: PMC2729417
- DOI: 10.1007/s10554-009-9481-y
Optimal phase for coronary interpretations and correlation of ejection fraction using late-diastole and end-diastole imaging in cardiac computed tomography angiography: implications for prospective triggering
Abstract
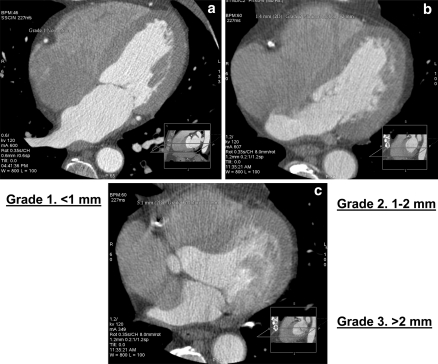
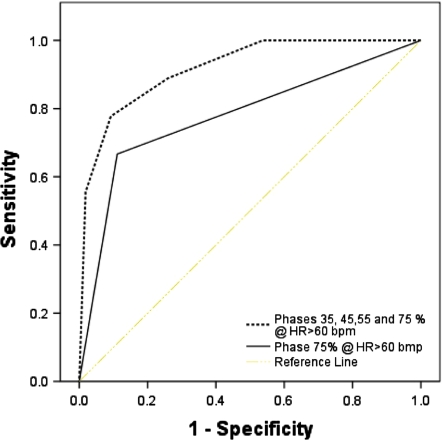
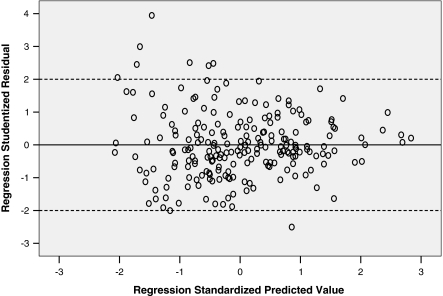
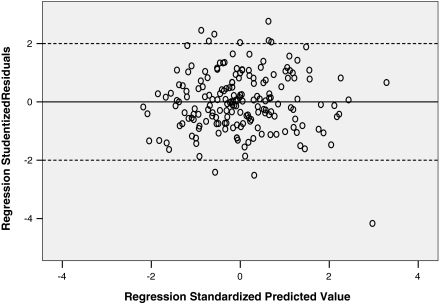
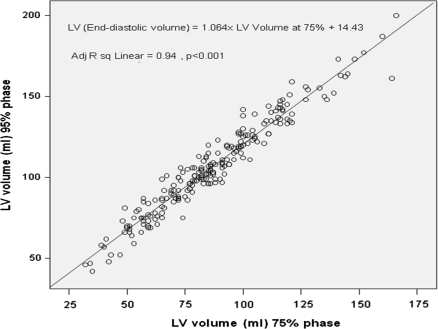
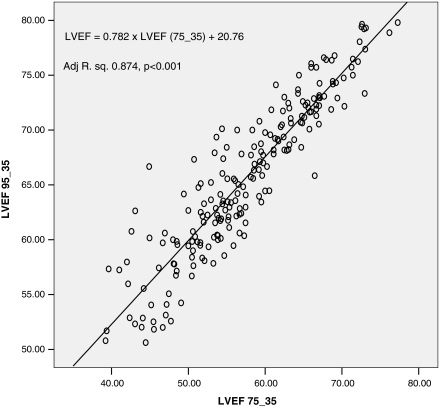
A typical acquisition protocol for multi-row detector computed tomography (MDCT) angiography is to obtain all phases of the cardiac cycle, allowing calculation of ejection fraction (EF) simultaneously with plaque burden. New MDCT protocols scanner, designed to reduce radiation, use prospectively acquired ECG gated image acquisition to obtain images at certain specific phases of the cardiac cycle with least coronary artery motion. These protocols do not we allow acquisition of functional data which involves measurement of ejection fraction requiring end-systolic and end-diastolic phases. We aimed to quantitatively identify the cardiac cycle phase that produced the optimal images as well as aimed to evaluate, if obtaining only 35% (end-systole) and 75% (as a surrogate for end-diastole) would be similar to obtaining the full cardiac cycle and calculating end diastolic volumes (EDV) and EF from the 35th and 95th percentile images. 1,085 patients with no history of coronary artery disease were included; 10 images separated by 10% of R-R interval were retrospectively constructed. Images with motion in the mid portion of RCA were graded from 1 to 3; with '1' being no motion, '2' if 0 to <1 mm motion, and '3' if there is >1 mm motion and/or non-interpretable study. In a subgroup of 216 patients with EF > 50%, we measured left ventricular (LV) volumes in the 10 phases, and used those obtained during 25, 35, 75 and 95% phase to calculate the EF for each patient. The average heart rate (HR) for our patient group was 56.5 +/- 8.4 (range 33-140). The distribution of image quality at all heart rates was 958 (88.3%) in Grade 1, 113 (10.42%) in Grade 2 and 14 (1.29%) in Grade 3 images. The area under the curve for optimum image quality (Grade 1 or 2) in patients with HR > 60 bpm for phase 75% was 0.77 +/- 0.04 [95% CI: 0.61-0.87], while for similar heart rates the area under the curve for phases 75 + 65 + 55 + 45% combined was 0.92 +/- 0.02. LV volume at 75% phase was strongly correlated with EDV (LV volume at 95% phase) (r = 0.970, P < 0.001). There was also a strong correlation between LVEF (75_35) and LVEF (95_35) (r = 0.93, P < 0.001). Subsequently, we developed a formula to correct for the decrement in LVEF using 35-75% phase: LVEF (95_35) = 0.783 x LVEF (75_35) + 20.68; adjusted R(2) = 0.874, P < 0.001. Using 64 MDCT scanners, in order to acquire >90% interpretable studies, if HR < 60 bpm 75% phase of RR interval provides optimal images; while for HR > 60 analysis of images in 4 phases (75, 35, 45 and 55%) is needed. Our data demonstrates that LVEF can be predicted with reasonable accuracy by using data acquired in phases 35 and 75% of the R-R interval. Future prospective acquisition that obtains two phases (35 and 75%) will allow for motion free images of the coronary arteries and EF estimates in over 90% of patients.
Figures
Similar articles
-
[Assessment of global and regional left ventricular function with a 16-slice spiral-CT using two different software tools for quantitative functional analysis and qualitative evaluation of wall motion changes in comparison with magnetic resonance imaging].Rofo. 2004 Dec;176(12):1786-93. doi: 10.1055/s-2004-813730. Rofo. 2004. PMID: 15573290 German.
-
Assessment of left ventricular ejection fraction with late-systolic and mid-diastolic cardiac phases using multi-slice computed tomography.Radiography (Lond). 2018 Nov;24(4):e85-e90. doi: 10.1016/j.radi.2018.04.007. Epub 2018 May 5. Radiography (Lond). 2018. PMID: 30292518
-
Can left ventricular end-diastolic volumes be estimated with prospective ECG-gated CT coronary angiography?Eur J Radiol. 2012 Feb;81(2):226-9. doi: 10.1016/j.ejrad.2010.12.034. Epub 2011 Jan 14. Eur J Radiol. 2012. PMID: 21237604
-
Role of cardiac CTA in estimating left ventricular volumes and ejection fraction.World J Radiol. 2014 Sep 28;6(9):669-76. doi: 10.4329/wjr.v6.i9.669. World J Radiol. 2014. PMID: 25276310 Free PMC article. Review.
-
Cardiac magnetic resonance imaging and its electrocardiographs (ECG): tips and tricks.Int J Cardiovasc Imaging. 2012 Aug;28(6):1465-75. doi: 10.1007/s10554-011-9957-4. Epub 2011 Oct 28. Int J Cardiovasc Imaging. 2012. PMID: 22033762 Free PMC article. Review.
Cited by
-
SmartFFR, a New Functional Index of Coronary Stenosis: Comparison With Invasive FFR Data.Front Cardiovasc Med. 2021 Aug 17;8:714471. doi: 10.3389/fcvm.2021.714471. eCollection 2021. Front Cardiovasc Med. 2021. PMID: 34490377 Free PMC article.
-
Left ventricular volume: an optimal parameter to detect systolic dysfunction on prospectively triggered 64-multidetector row computed tomography: another step towards reducing radiation exposure.Int J Cardiovasc Imaging. 2011 Oct;27(7):1015-23. doi: 10.1007/s10554-010-9740-y. Epub 2010 Nov 10. Int J Cardiovasc Imaging. 2011. PMID: 21063782 Free PMC article.
-
320-row CT: does beat-to-beat motion of the coronary arteries affect image quality?Int J Cardiovasc Imaging. 2012 Jan;28(1):147-51. doi: 10.1007/s10554-010-9794-x. Epub 2011 Jan 30. Int J Cardiovasc Imaging. 2012. PMID: 21279691 Free PMC article. No abstract available.
-
Noninvasive evaluation of global and regional left ventricular function using computed tomography and magnetic resonance imaging: a meta-analysis.Eur Radiol. 2017 Apr;27(4):1640-1659. doi: 10.1007/s00330-016-4513-1. Epub 2016 Aug 10. Eur Radiol. 2017. PMID: 27510625
-
Prospective helical acquisition for coronary CT angiography.Int J Cardiovasc Imaging. 2010 Jan;26(1):109-10. doi: 10.1007/s10554-009-9530-6. Epub 2009 Nov 18. Int J Cardiovasc Imaging. 2010. PMID: 19921461 No abstract available.
References
-
- {'text': '', 'ref_index': 1, 'ids': [{'type': 'DOI', 'value': '10.1259/bjr/30634988', 'is_inner': False, 'url': 'https://doi.org/10.1259/bjr/30634988'}, {'type': 'PubMed', 'value': '15546845', 'is_inner': True, 'url': 'https://pubmed.ncbi.nlm.nih.gov/15546845/'}]}
- Kopp AF, Kuttner A, Trabold T, Heuschmid M, Schroder S, Claussen CD (2004) Multislice CT in cardiac and coronary angiography. Br J Radiol 77:87–97 - PubMed
-
- {'text': '', 'ref_index': 1, 'ids': [{'type': 'DOI', 'value': '10.1148/radiol.2321021803', 'is_inner': False, 'url': 'https://doi.org/10.1148/radiol.2321021803'}, {'type': 'PubMed', 'value': '15220490', 'is_inner': True, 'url': 'https://pubmed.ncbi.nlm.nih.gov/15220490/'}]}
- Schoenhagen P, Halliburton SS, Stillman AE et al (2004) Noninvasive imaging of coronary arteries: current and future role of multi-detector row CT. Radiology 232:7–17 - PubMed
-
- {'text': '', 'ref_index': 1, 'ids': [{'type': 'DOI', 'value': '10.1016/S1076-6332(03)80082-X', 'is_inner': False, 'url': 'https://doi.org/10.1016/s1076-6332(03)80082-x'}, {'type': 'PubMed', 'value': '12809417', 'is_inner': True, 'url': 'https://pubmed.ncbi.nlm.nih.gov/12809417/'}]}
- Mao S, Lu B, Takasu J, Oudiz RJ, Budoff MJ (2003) Measurement of the RT interval on ECG records during electron-beam CT. Acad Radiol 10(6):638–643 - PubMed
-
- {'text': '', 'ref_index': 1, 'ids': [{'type': 'DOI', 'value': '10.1148/radiol.2482071804', 'is_inner': False, 'url': 'https://doi.org/10.1148/radiol.2482071804'}, {'type': 'PubMed', 'value': '18574140', 'is_inner': True, 'url': 'https://pubmed.ncbi.nlm.nih.gov/18574140/'}]}
- Hirai N, Horiguchi J, Fujioka C, Kiguchi M, Yamamoto H, Matsuura N, Kitagawa T, Teragawa H, Kohno N, Ito K (2008) Prospective versus retrospective ECG-gated 64-detector coronary CT angiography: assessment of image quality, stenosis, and radiation dose. Radiology 248(2):424–430 Epub 2008 Jun 23 - PubMed
-
- {'text': '', 'ref_index': 1, 'ids': [{'type': 'DOI', 'value': '10.1097/01.rli.0000202639.99949.c6', 'is_inner': False, 'url': 'https://doi.org/10.1097/01.rli.0000202639.99949.c6'}, {'type': 'PubMed', 'value': '16625106', 'is_inner': True, 'url': 'https://pubmed.ncbi.nlm.nih.gov/16625106/'}]}
- Wintersperger BJ, Nikolaou K, von Ziegler F, Johnson T, Rist C, Leber A, Flohr T, Knez A, Reiser MF, Becker CR (2006) Image quality, motion artifacts, and reconstruction timing of 64-slice coronary computed tomography angiography with 0.33-second rotation speed. Invest Radiol 41(5):436–442 - PubMed
