. 2009 Oct 1;516(4):241-63.
doi: 10.1002/cne.22139.

A bushy cell network in the rat ventral cochlear nucleus

Affiliations

A bushy cell network in the rat ventral cochlear nucleus

Ricardo Gómez-Nieto et al. J Comp Neurol. .

Abstract

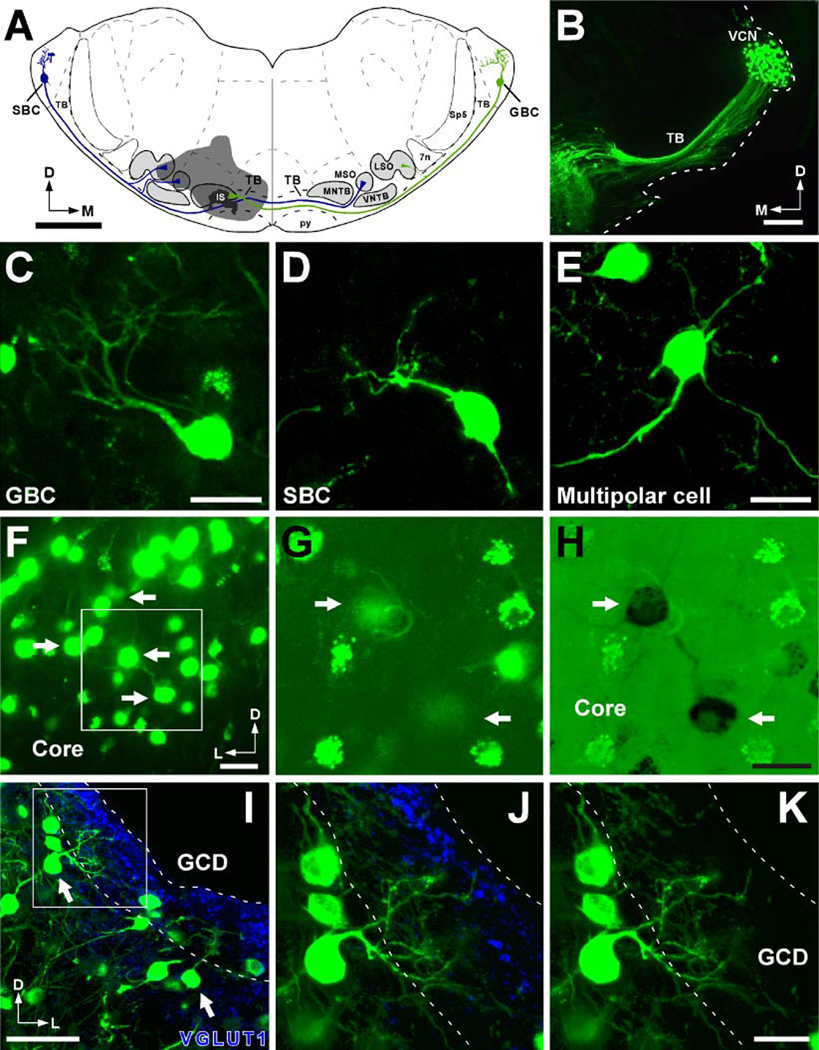
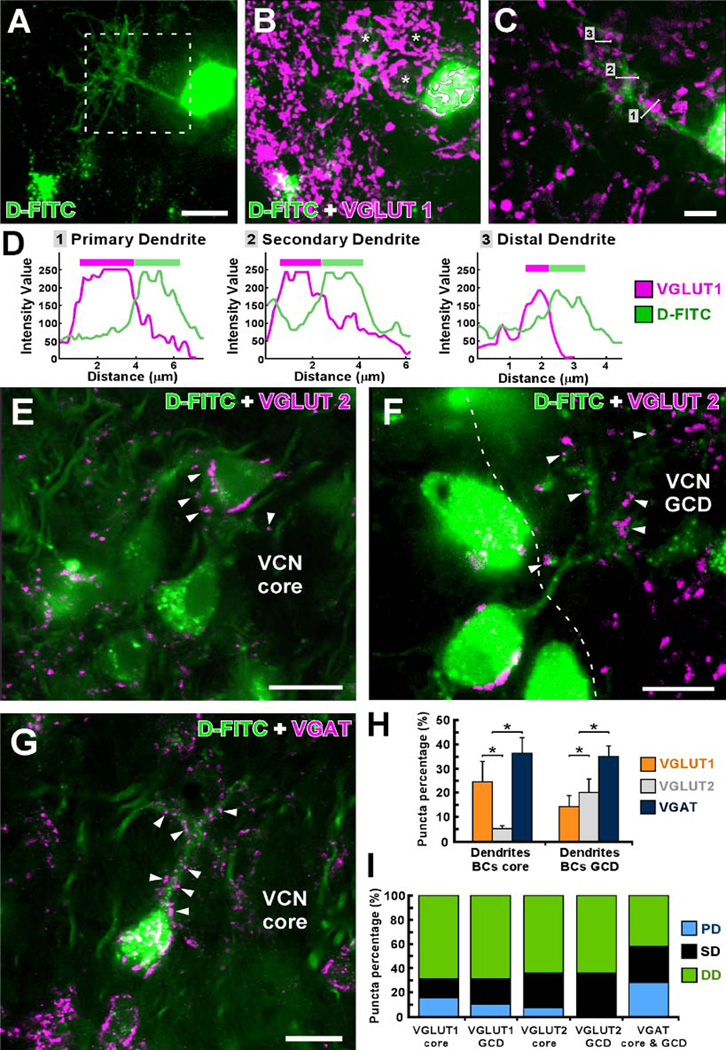
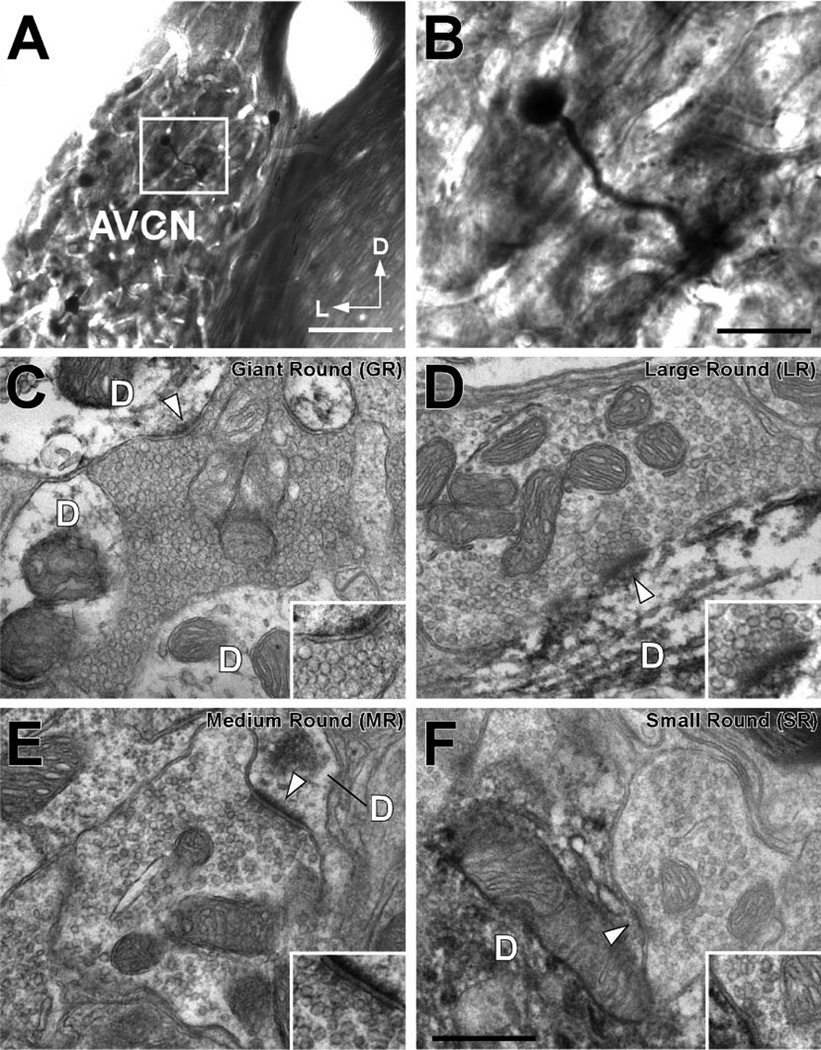
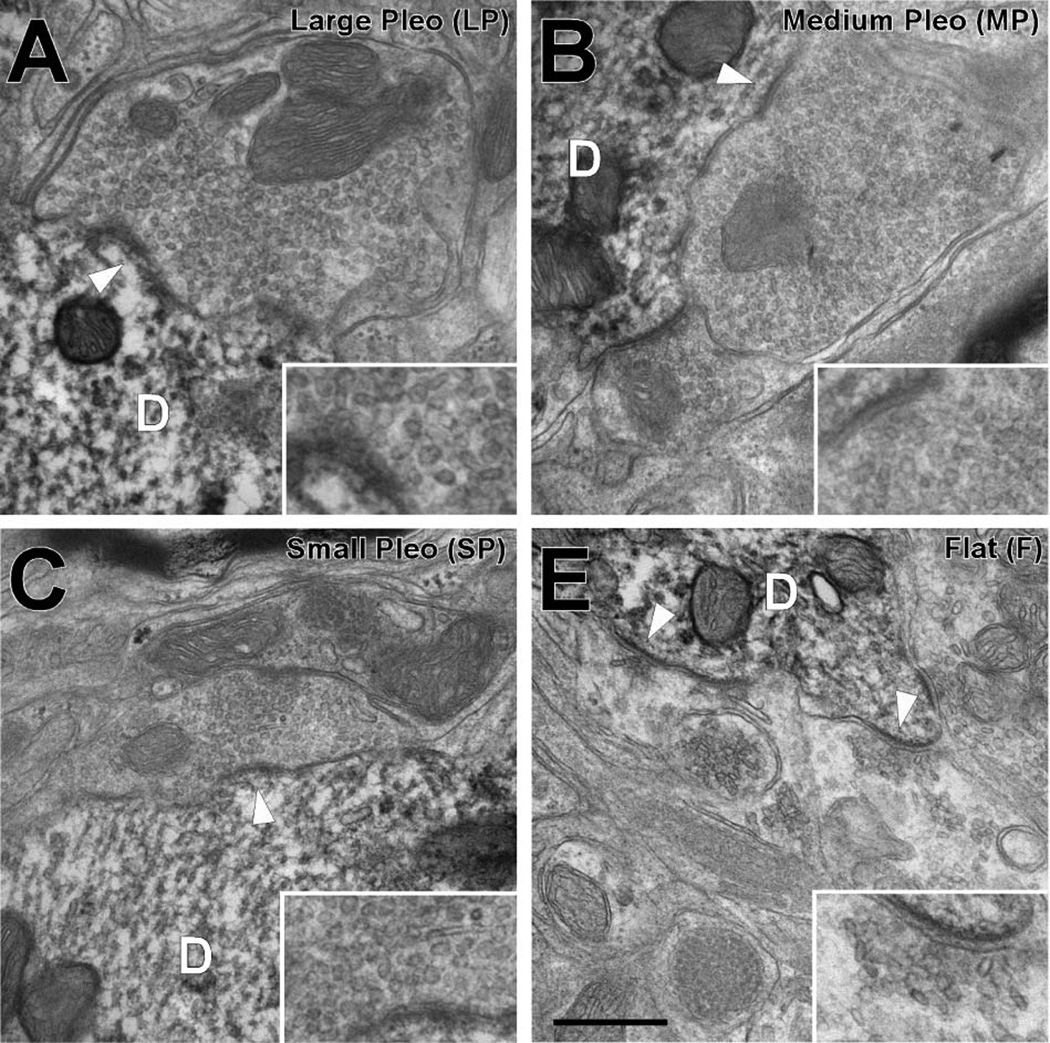
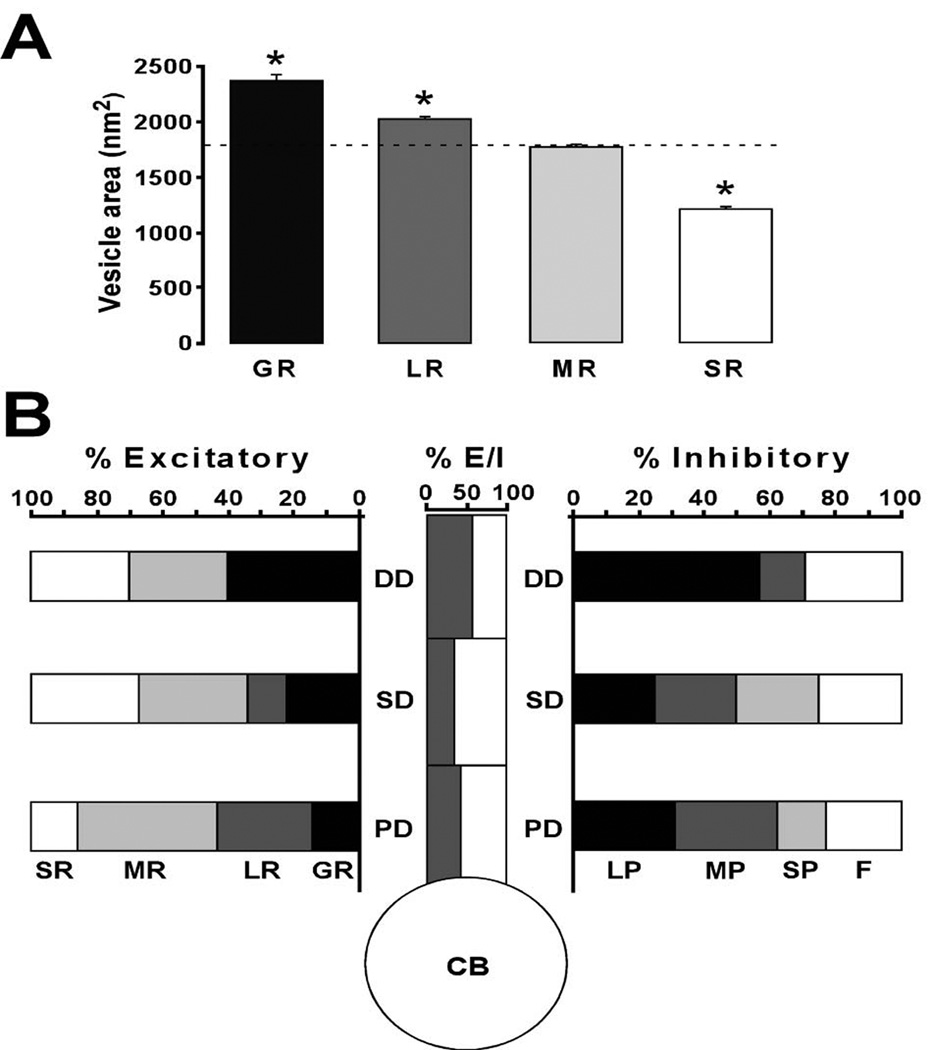
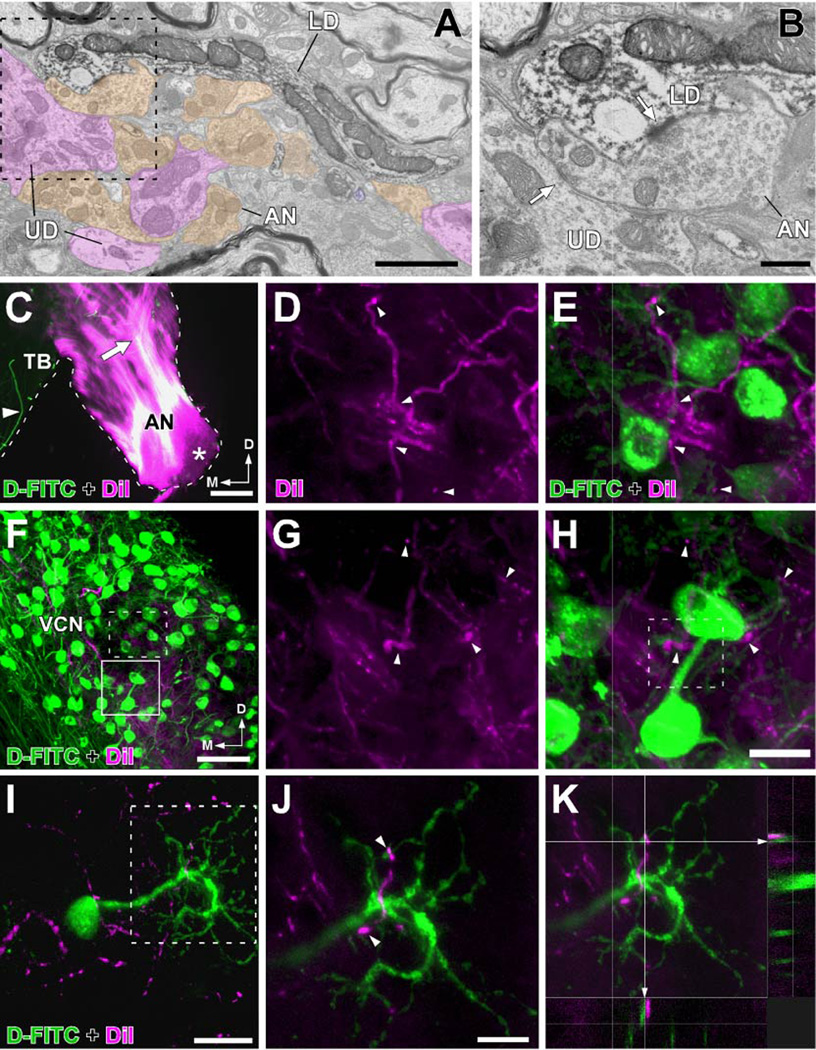
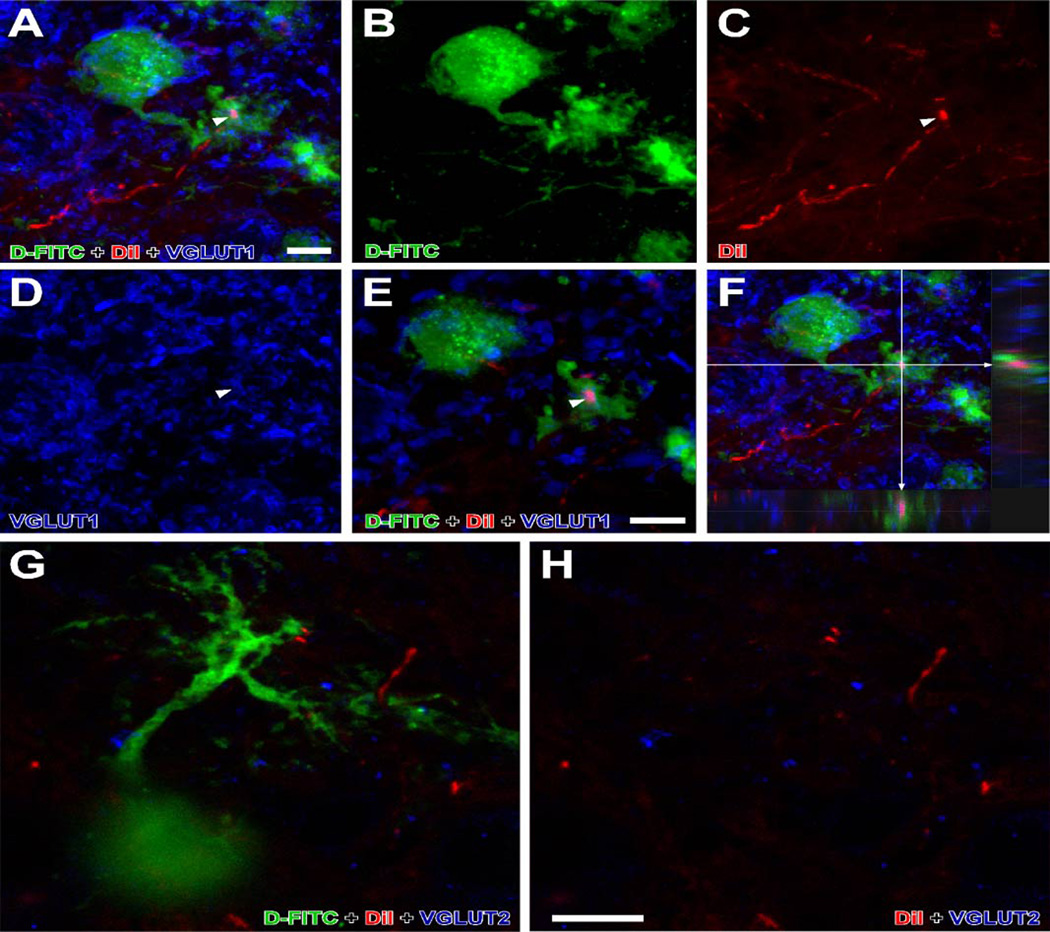
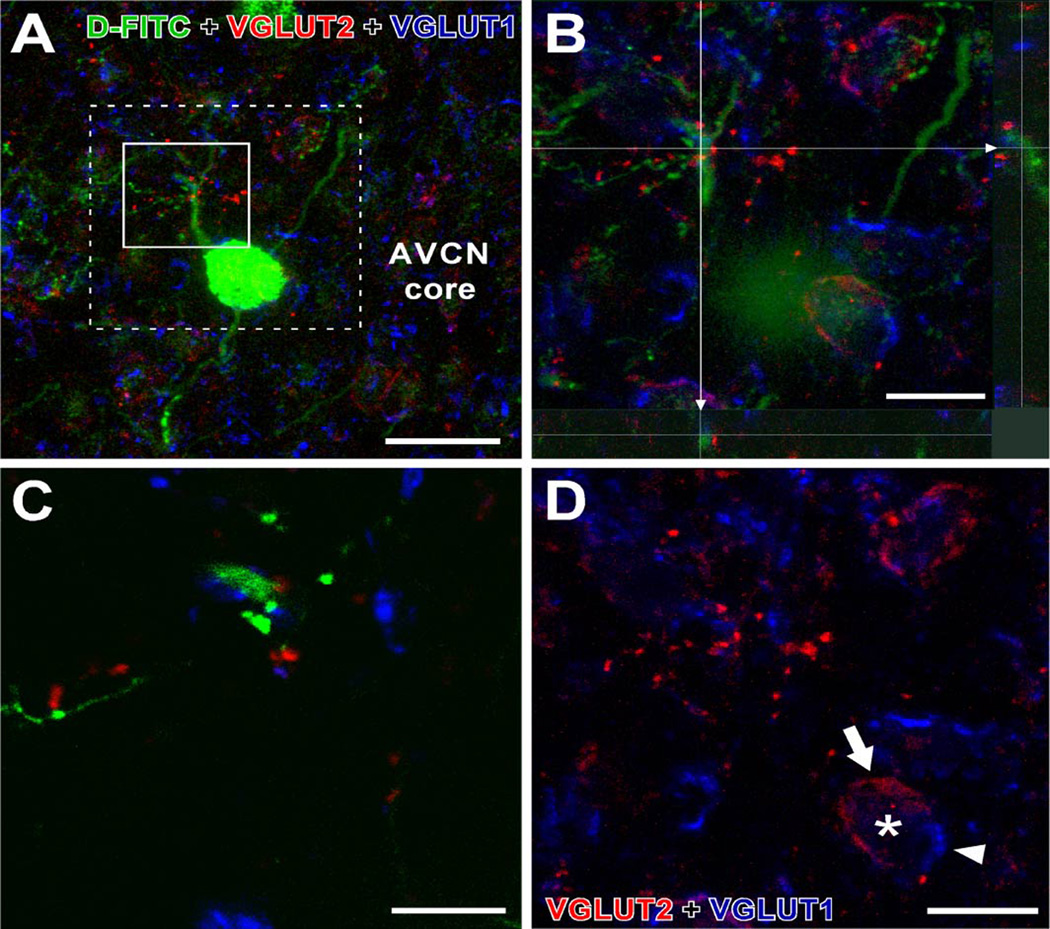
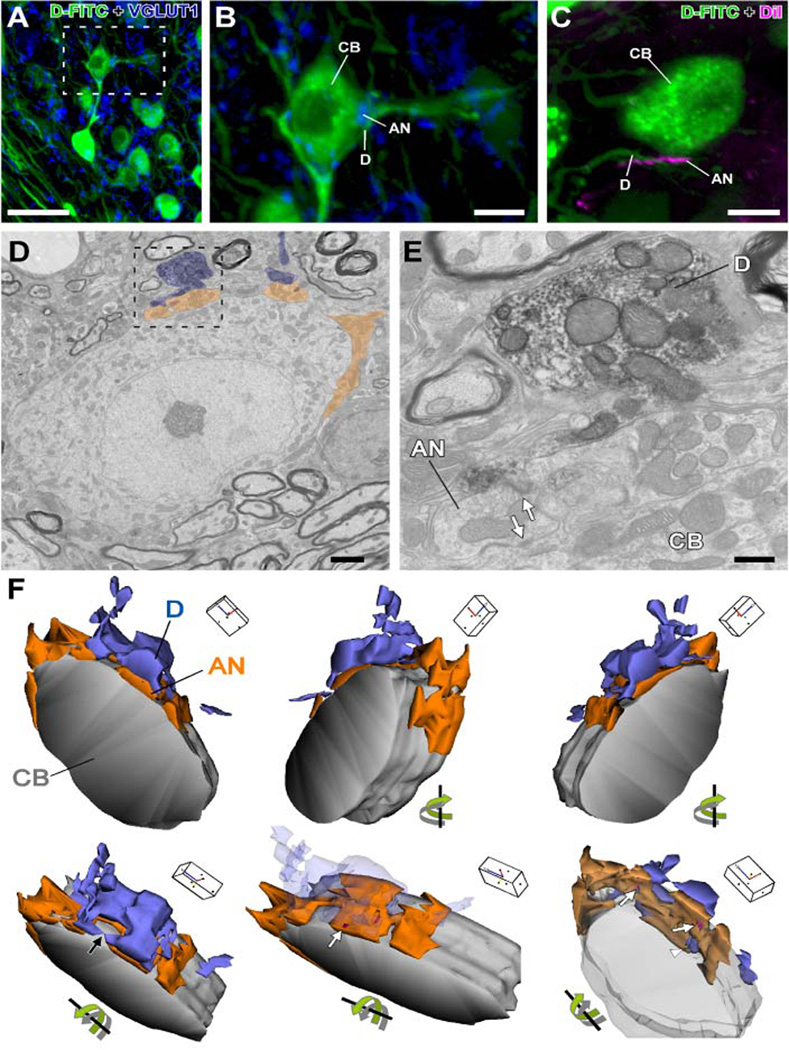
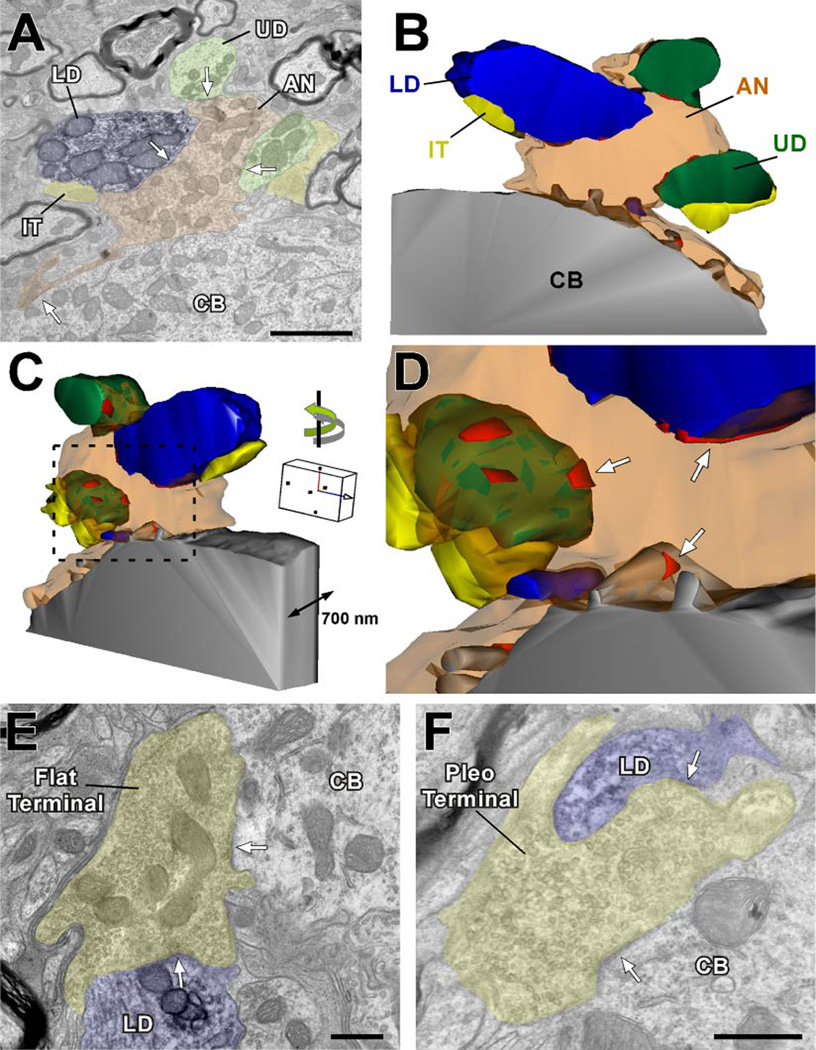
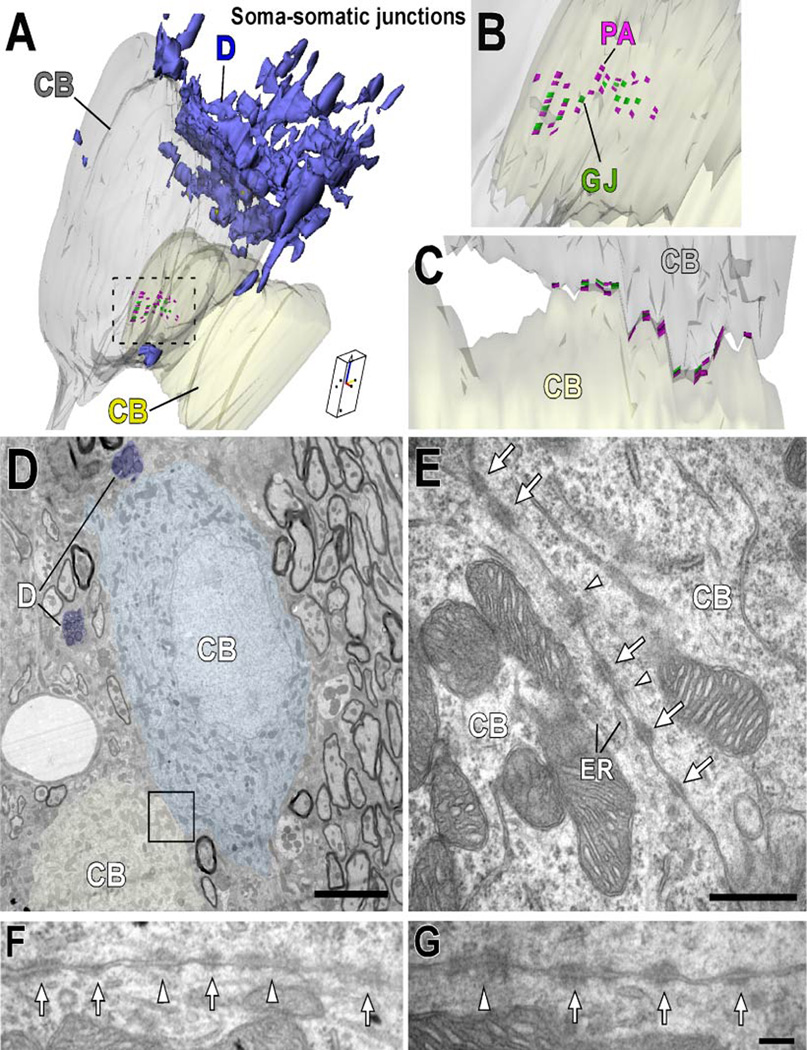
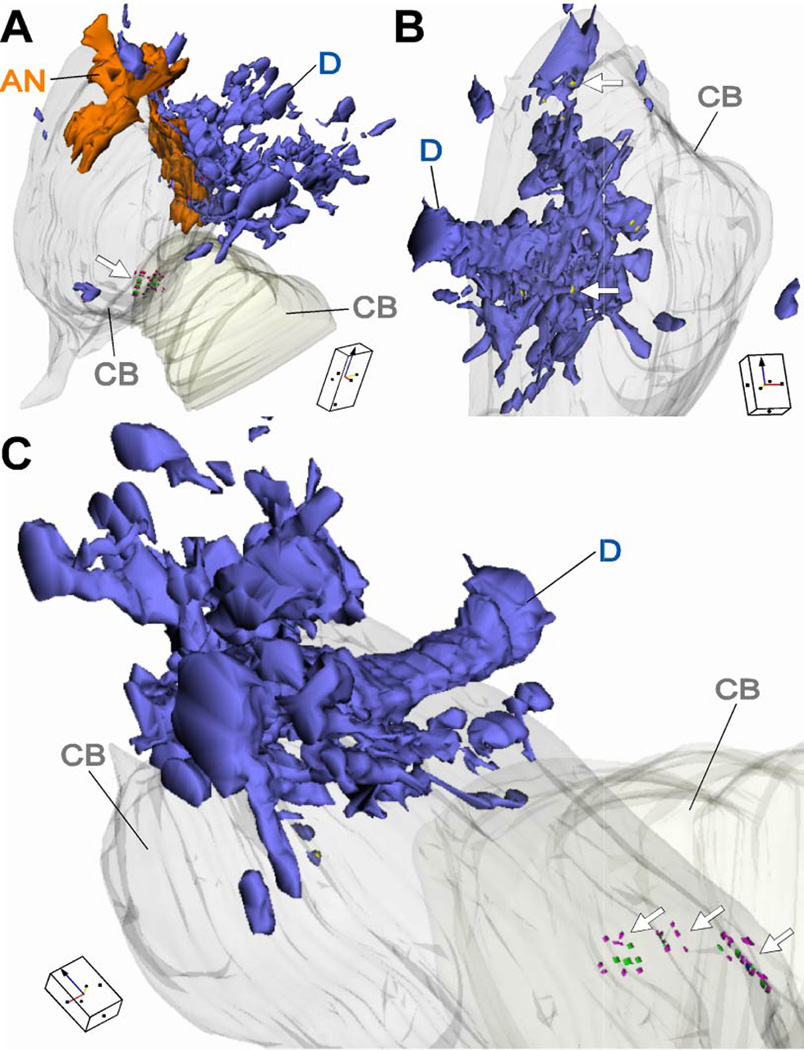
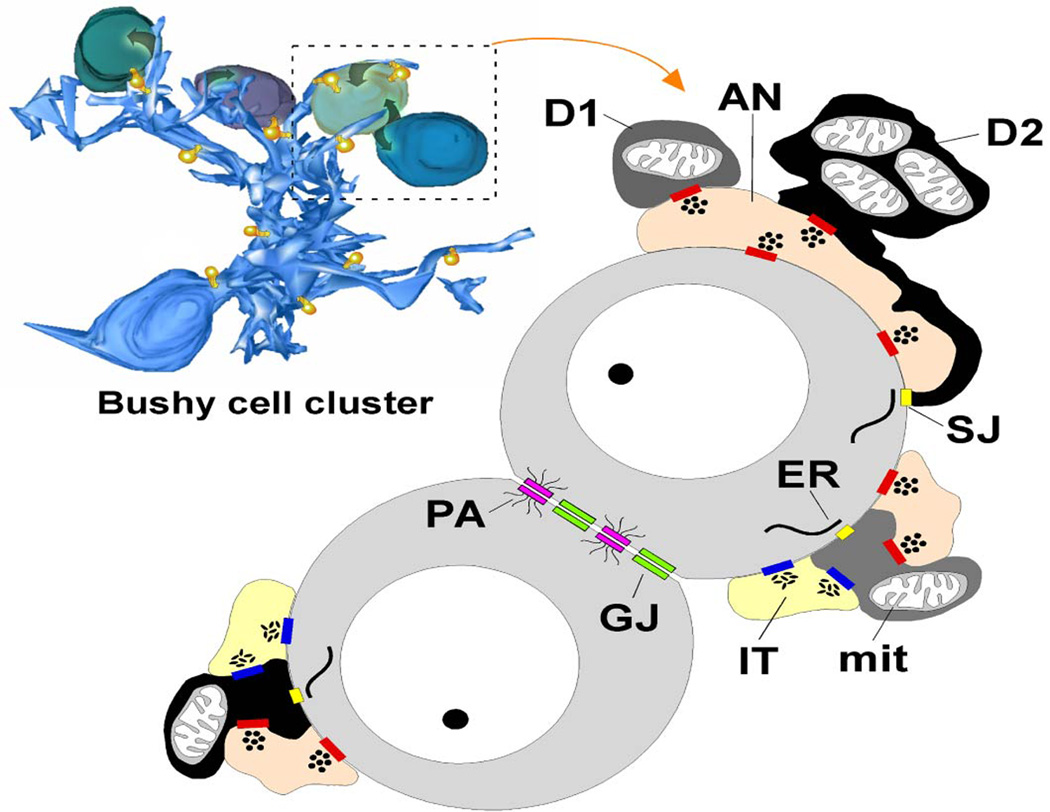
Geometry of the dendritic tree and synaptic organization of afferent inputs are essential factors in determining how synaptic input is integrated by neurons. This information remains elusive for one of the first brainstem neurons involved in processing of the primary auditory signal from the ear, the bushy cells (BCs) of the ventral cochlear nucleus (VCN). Here, we labeled the BC dendritic trees with retrograde tracing techniques to analyze their geometry and synaptic organization after immunofluorescence for excitatory and inhibitory synaptic markers, electron microscopy, morphometry, double tract-tracing methods, and 3D reconstructions. Our study revealed that BC dendrites provide space for a large number of compartmentalized excitatory and inhibitory synaptic interactions. The dendritic inputs on BCs are of cochlear and noncochlear origin, and their proportion and distribution are dependent on the branching pattern and orientation of the dendritic tree in the VCN. Three-dimensional reconstructions showed that BC dendrites branch and cluster with those of other BCs in the core of the VCN. Within the cluster, incoming synaptic inputs establish divergent multiple-contact synapses (dyads and triads) between BCs. Furthermore, neuron-neuron connections including puncta adherentia, sarcoplasmic junctions, and gap junctions are common between BCs, which suggests that these neurons are electrically coupled. Overall, our study demonstrates the existence of a BC network in the rat VCN. This network may establish the neuroanatomical basis for acoustic information processing by individual BCs as well as for enhanced synchronization of the output signal of the VCN.


Figures

Figure 1
Figure 1. Organization of bushy cell (BC) dendrites in the ventral cochlear nucleus (VCN)
A, Schematic drawing of a D-FITC injection site (IS) into the region of the trapezoid body (TB). The darker gray area around the IS corresponds to the region of D-FITC diffusion. B, Micrograph of retrogradely labeled BCs of the contralateral VCN. Labeled axons of BCs run in the contralateral TB. C–E, Confocal micrographs show representative examples of globular bushy cells (C, GBC), spherical bushy cells (D, SBC), and multipolar stellate cells (E) retrogradely labeled with D-FITC. F–H, Confocal micrographs of maximum (F), stereo (G), and transparency (H) projections of BCs in the core of the VCN. In this region, BC dendrites branch in the vicinity of nearby BCs somata and surround cell bodies (arrows). I–K, Confocal micrographs of BCs in the superficial region of the VCN. In this region, BC dendrites enter and branch within the granular cell domain (GCD) immunostained for VGLUT1 (blue puncta). Dashed lines indicate the internal and external edges of the GCD. LSO, lateral superior olive; MNTB, medial nucleus of the trapezoid body; MSO, medial superior olive; Py, pyramidal tract; VNTB, ventral nucleus of the trapezoid body; 7n, facial nucleus; Sp5, spinal trigeminal nucleus. Scale bars: A, 1mm; B, 250 µm; C, D, E, G, H, J, K, 25 µm; F, I, 75 µm.
Figure 2
Figure 2. Excitatory and inhibitory neurotransmitter signaling on dendrites of bushy cells (BCs)
A, Confocal image of a spherical-BC retrogradely labeled with D-FICT (green). B, Confocal image shows dendrites of the BC shown in A decorated with VGLUT1-immunolabeled terminals (red). Asterisks represent the space of unlabeled D-FITC BCs. C, Confocal image of the area boxed in A shows VGLUT1-immunolabeled puncta distributed from proximal to distal dendrites. D, Intensity profile in each dendritic site confirms that VGLUT1 terminals are in close apposition to primary, secondary and distal dendrites (1–3). E, Confocal image shows scattered VGLUT2 immunolabeling (arrowheads) on dendrites and cell bodies of BCs in the central region of the core. F, Confocal image shows VGLUT2 immunolabeling (arrowheads) on BC dendrites distributed within the granular cell domain (GCD). The dashed line indicates the internal boundary of the GCD. Notice BC dendrites in the GCD receive many VGLUT2 terminals compared to the ones in the core region. G, Confocal image shows VGAT immunolabeled terminals (arrowheads) on retrogradely labeled BC dendrites. H, Percentage of immunolabeled VGLUT1, VGLUT2 and VGAT terminals on BC dendrites located in the core and GCD. Error bars represent SEM, *P < 0.5. I, Counts of immunolabeled VGLUT1, VGLUT2 and VGAT terminals at different dendritic sites (PD, primary dendrite; SC, secondary dendrite; DD, distal dendrites) of BCs located in the core and GCD. VCN, ventral cochlear nucleus. Scale bars: A, B, E, F, G, 20 µm; C, 15 µm.
Figure 3
Figure 3. Excitatory synaptic inputs on spherical bushy cell (SBC) dendrites
A–B, Light microscopy images show the area and the BDA-labeled BC in the ventral cochlear nucleus (VCN) selected for the electron microscopy analysis. C–F, Electron Micrographs show representative examples of excitatory synaptic terminals on SBC dendrites (D) identified by the black reaction product of BDA. Four different types of excitatory synaptic terminals were identified depending on morphometric parameters of their synaptic vesicles: Giant Round (GR), Large Round (RD), Medium Round (MR) and Small Round (SR). Arrowheads indicate the postsynaptic density. Insets in each micrograph show details of the synaptic vesicles. Scale bars: A, 100 µm; B, 25 µm; C–F, 500 nm.
Figure 4
Figure 4. Inhibitory synaptic inputs on spherical bushy cell (SBC) dendrites
A–E, Electron Micrographs show examples of inhibitory synaptic terminals on SBC dendrites filled with the tracer. Four different types of inhibitory synaptic terminals were identified depending on morphometric parameters of their synaptic vesicles: Large Pleomorphic (LP), Medium Pleomorphic (MP), Small Pleomorfic (SP) and Flat (F). Insets in each micrograph show details of the synaptic vesicles. Scale bars: A–E, 500 nm.
Figure 5
Figure 5. Synaptic distribution of excitatory inputs on spherical bushy cell (SBC) dendrites
A, Histogram shows the vesicle area of excitatory terminals. Error bars represent SEM. The horizontal dashed line indicates the vesicle area of endbulb-like terminals on the SBC soma. Asterisks indicate significant differences of each of the group with the endbulb like terminals. B, Distribution of excitatory (E) and inhibitory (I) terminals at different dendritic sites. The histogram shows the percentage of synaptic terminals on primary, secondary and distal dendrites (PD, SD, DD). Black indicates GR and LP; dark gray indicates LR and SP; light gray indicates MR and SP; white indicates SR and F.
Figure 6
Figure 6. Projection from the auditory nerve to bushy cell (BC) dendrites
A–B: Electron micrographs show the synaptic interactions of AN terminals (orange color) with dendrites of two different BCs (BDA-labeled dendrite, black and unlabeled dendrite, pink). Arrows indicate the postsynaptic densities. C, Micrograph of a DiI injection into the cochlear root (asterisk). Note auditory nerve fibers (AN) ascending to the ventral cochlear nucleus (VCN; arrow) and BC axons labeled with D-FITC in the trapezoid body (TB; arrowhead). F, Low magnification confocal image of the VCN. D–E and G–H, Detail of the areas boxed in B shows AN terminals in apposition to dendrites of BCs (arrowheads). I–J–K, Confocal images show a retrogradely labeled BC and AN fibers labeled with DiI. Orthogonal view in I confirms that AN terminals is in apposition with distal dendrites (arrowheads). Scale bars: A, 2 µm; B, 500 nm; C, 500 µm; F, 70 µm; D-E-G-H-I, 20 µm; J–K, 10 µm.
Figure 7
Figure 7. Origin of excitatory inputs on bushy cell (BC) dendrites
A, Confocal image shows VGLUT1 colabeled with auditory nerve terminals (DiI) on BC dendrites retrogradely labeled with D-FITC. This image is the merge of the three maximum z-series projection shown in B, C, and D. B, Confocal image of a retrogradely labeled BC after D-FITC injection in the TB-MNTB. C, Auditory nerve terminal labeled with DiI (arrowhead) after injection in the cochlear root. D, Confocal image shows VGLUT1 immunolaled puncta (arrowhead). Colocalization of VGluT1 puncta and DiI (arrowhead) is confirmed by the 1 µm confocal image (E) and the orthogonal view (F). G–H, Confocal images show non-overlapping immunolabeling of VGLUT2 puncta and DiI terminals on BC dendrites. Scale bars: A–H, 10 µm.
Figure 8
Figure 8. VGLUTs isoforms do not overlap on bushy cell (BC) dendrites
A, Confocal image of double immunolabeling for VGLUT1 and VGLUT2 puncta on a BC retrogradely labeled with D-FITC. One µm confocal image (B) and orthogonal view (C) of the areas boxed in A confirm that VGLUT1 and VGLUT2 puncta do not overlap on BC dendrites. D, Confocal image shows VGLUT1 and VGLUT2 puncta (arrowhead and arrow, respectively) distributed at opposite poles of an unlabeled cell body (asterisk). Scale bars: A–D, 40 µm.
Figure 9
Figure 9. Relationship between endbulbs of Held and clusters of bushy cells(BCs)
A, Confocal image show VGLUT1-endbulb like puncta distributed in between distal BC dendrites (D) and a neighboring BC soma (CB) retrogradely labeled with D-FITC. B, High magnification confocal image of the dashed square in A shows the relation of VGLUT1 puncta (blue) with different BCs within the cluster. C, Confocal image of an auditory nerve (AN) fiber labeled with DiI (red) distributed in between the soma and distal dendrites of two different BCs. D, Electron micrographs shows a distal dendrite of a labeled BC (blue color) in the proximity of an unlabeled BC soma. The auditory nerve colored in orange is located in between both cells. E, High magnification electron micrograph of the area dashed in C shows the AN making synaptic contacts (arrows) on the cell body and the labeled dendrite (synaptic dyad). F, Computer-aided 3D-reconstruction from 13 serial sections of the BC showed in D. The images show different views of the 3-D. Notice the complex interactions between the AN terminal and the two BCs. Black arrow indicates the empty space occupied for a non-cochlear terminal. White arrows indicate postsynaptic densities. Arrowhead indicates dendro-somatic contact. Scale bars: A, 40 µm; B–C, 10 µm; D, 2 µm; E, 500 nm.
Figure 10
Figure 10. Divergent multiple-contact synapses within bushy cell (BC) clusters
A, Representative electron micrograph shows a synaptic excitatory triad. Arrows indicate the postsynaptic densities of the BDA labeled dendrite (LD, blue), the unlabeled dendrite (UD, green) and the unlabeled cell body (CB) receiving the auditory nerve (AN, orange). B, 3D-reconstruction from the synaptic excitatory triad in A. C, Image shows a different view from the same 3-D. D, Detail of the dashed square in C highlights the synaptic region of the AN with the two dendrites and the cell body. E–F, Inhibitory terminals containing flat (E) or pleomorphic (F) vesicles make axodendro-somatic dyad between BCs. Arrows indicate postsynaptic densities. Scale bars: A, 2 µm; E–F, 500 nm;
Figure 11
Figure 11. Dendro-somatic junctions within the bushy cell (BC) cluster
A. 3D-reconstruction of a dendritic process (D) of a BC contacting through sarcoplasmic junctions (SJ) the cell body (CB) of another BC. Notice the SJ locates in close proximity to the endbulb synapses. B–C, Representative serial electron micrographs of the sarcoplasmic junction reconstructed in A. Arrow indicates the electrondense material at the junction. D–E, Electron micrographs show detail of a labeled filopodia-like dendritic process making a sarcoplasmic junction (arrow) with a nearby unlabeled BC soma. F–G–H, Electron micrographs show serial sections of a large labeled dendrite making a dendro-somatic junction with an unlabeled BC soma. Chlatrin coated pits (CCP) and membranes of endoplasmic reticulum (ER) are symmetrically distributed in the dendrite and the cell body. Asterisk highlights a multivesicular body. Scale bars: B–C; E, 500nm; F–H, 200 nm.
Figure 12
Figure 12. Soma-somatic junctions within the bushy cell (BC) cluster
A, 3D-reconstruction of two BC somata connected by soma-somatic junctions. The junctions between the two cell bodies (CB) were identified in the corresponding serial electron micrographs as gap junctions (GJ, green) and puncta adherentia (PA, pink). B–C, 3D surface reconstructions of the area dashed in A, show different views of the apposition area between the two BC cell bodies. D, Representative electron micrograph of the 3D-reconstruction in A (dark blue: labeled dendrite; pale blue and yellow: unlabeled somata of two BCs). E, High-magnification electron micrographs of the boxed area in D shows the soma-somatic junctions. Gap junctions (arrowheads) and puncta adherentia (arrows) are distributed alternating in the apposition zone between the two cell bodies. F–G, Images of 2 serial ultrathin sections of the boxed area in B. AN, auditory nerve; D, dendrite; GC, glial cell. Scale bars: D, 5 µm; E, 500 nm; F–G, 200 nm.
Figure 13
Figure 13. 3D-reconstruction of three bushy cells (BCs) in the neuronal network of the rat ventral cochlear nucleus (VCN)
A, 3D-reconstruction of a tufted distal dendrite (blue) within a BC cluster obtained from a stack of 120 serial ultrathin sections and with a thickness of ~80 nm each. B, 3D rendering shows dendro-somatic junctions in the form of sarcoplasmic junctions (yellow color). C, 3D rendering shows soma-somatic junctions (green color, gap junctions; pink color, puncta adherentia) connecting the cell bodies of two BCs. Arrows indicate some membrane junctions between BCs. AN, auditory nerve; CB, cell body; D, dendrite.
Figure 14
Figure 14. Summary diagrams of the bushy cell (BC) network in the ventral cochlear nucleus (VCN)
The 3-D reconstruction on the left represents a BC cell cluster. It was obtained from 73 serial confocal images of a D-FITC labeled BC and the nearby BCs immunostained for VGLUT1 (yellow puncta). The scheme on the right represents the connections between four BCs within the cluster. Dendro-somatic junctions are characterized by sarcoplasmic junctions (SJ). Excitatory and inhibitory terminals within the cluster make divergent synaptic dyads and triads with the cell body and dendrites of BCs (red and blue rectangles represent excitatory and inhibitory postsynaptic densities). Soma-somatic junctions are characterized by puncta adherentia (PA) and gap junctions (GJ). AN, auditory nerve; CB, cell body; D1, dendrite 1; D2, dendrite 2; ER, endoplasmic reticulum; IT, inhibitory terminal.

Similar articles

Cited by

References

    1. Agmon-Snir H, Carr CE, Rinzel J. The role of dendrites in auditory coincidence detection. Nature. 1998;393(6682):268–272. - PubMed
    1. Asako M, Holt AG, Griffith RD, Buras ED, Altschuler RA. Deafness-related decreases in glycine-immunoreactive labeling in the rat cochlear nucleus. J Neurosci Res. 2005;81(1):102–109. - PMC - PubMed
    1. Altschuler RA, Betz H, Parakkal MH, Reeks KA, Wenthold RJ. Identification of glycinergic synapses in the cochlear nucleus through immunocytochemical localization of the postsynaptic receptor. Brain Res. 1986;369(1–2):316–320. - PubMed
    1. Benson TE, Berglund AM, Brown MC. Synaptic input to cochlear nucleus dendrites that receive medial olivocochlear synapses. J Comp Neurol. 1996;365(1):27–41. - PubMed
    1. Brawer JR, Morest DK. Relations between auditory nerve endings and cell types in the cat's anteroventral cochlear nucleus seen with the Golgi method and Nomarski optics. J Comp Neurol. 1975;160(4):491–506. - PubMed

Publication types