

Plant traits correlated with generation time directly affect inbreeding depression and mating system and indirectly genetic structure
- PMID: 19635127
- PMCID: PMC2728730
- DOI: 10.1186/1471-2148-9-177
Plant traits correlated with generation time directly affect inbreeding depression and mating system and indirectly genetic structure
Abstract
Background: Understanding the mechanisms that control species genetic structure has always been a major objective in evolutionary studies. The association between genetic structure and species attributes has received special attention. As species attributes are highly taxonomically constrained, phylogenetically controlled methods are necessary to infer causal relationships. In plants, a previous study controlling for phylogenetic signal has demonstrated that Wright's FST, a measure of genetic differentiation among populations, is best predicted by the mating system (outcrossing, mixed-mating or selfing) and that plant traits such as perenniality and growth form have only an indirect influence on FST via their association with the mating system. The objective of this study is to further outline the determinants of plant genetic structure by distinguishing the effects of mating system on gene flow and on genetic drift. The association of biparental inbreeding and inbreeding depression with population genetic structure, mating system and plant traits are also investigated.
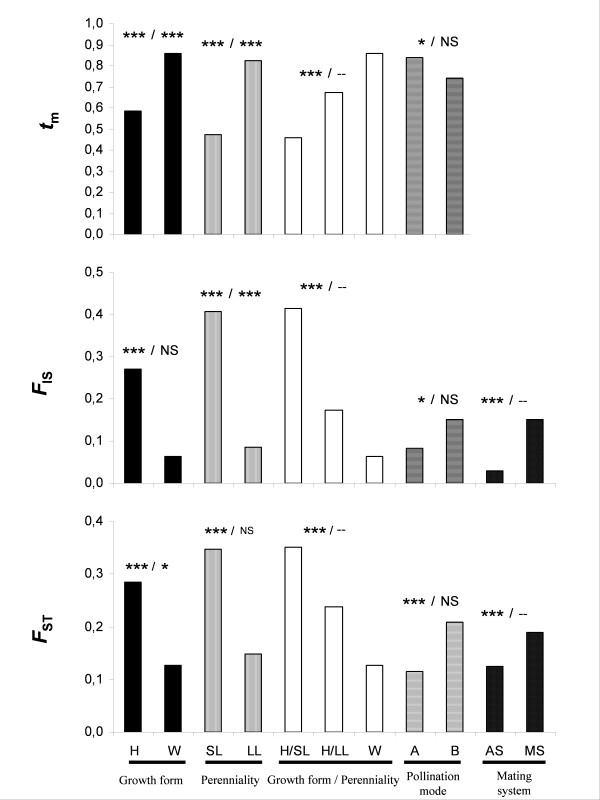
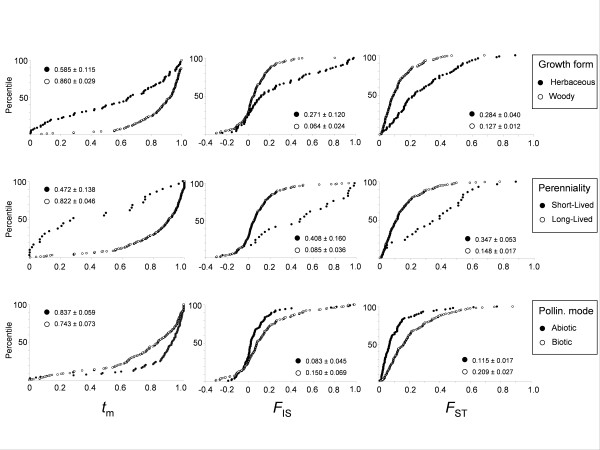
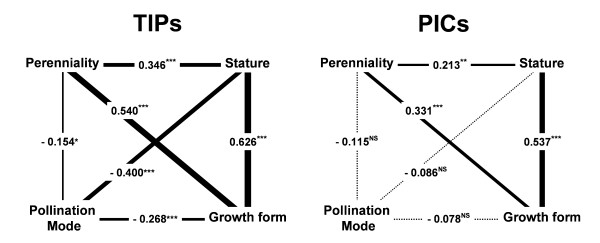
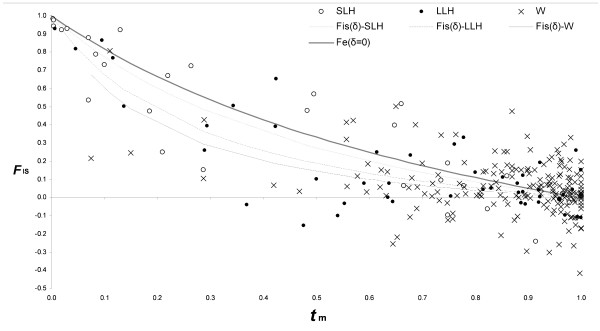
Results: Based on data from 263 plant species for which estimates of FST, inbreeding (FIS) and outcrossing rate (tm) are available, we confirm that mating system is the main influencing factor of FST. Moreover, using an alternative measure of FST unaffected by the impact of inbreeding on effective population size, we show that the influence of tm on FST is due to its impact on gene flow (reduced pollen flow under selfing) and on genetic drift (higher drift under selfing due to inbreeding). Plant traits, in particular perenniality, influence FST mostly via their effect on the mating system but also via their association with the magnitude of selection against inbred individuals: the mean inbreeding depression increases from short-lived herbaceous to long-lived herbaceous and then to woody species. The influence of perenniality on mating system does not seem to be related to differences in stature, as proposed earlier, but rather to differences in generation time.
Conclusion: Plant traits correlated with generation time affect both inbreeding depression and mating system. These in turn modify genetic drift and gene flow and ultimately genetic structure.
Figures
Similar articles
-
Inbreeding depression under mixed outcrossing, self-fertilization and sib-mating.BMC Evol Biol. 2016 May 17;16:105. doi: 10.1186/s12862-016-0668-2. BMC Evol Biol. 2016. PMID: 27188583 Free PMC article.
-
Mitosis, stature and evolution of plant mating systems: low-Phi and high-Phi plants.Proc Biol Sci. 2006 Feb 7;273(1584):275-82. doi: 10.1098/rspb.2005.3304. Proc Biol Sci. 2006. PMID: 16543169 Free PMC article.
-
Mating system of Datura inoxia: association between selfing rates and herkogamy within populations.PeerJ. 2021 Mar 19;9:e10698. doi: 10.7717/peerj.10698. eCollection 2021. PeerJ. 2021. PMID: 33777507 Free PMC article.
-
Interactions between insect herbivores and plant mating systems.Annu Rev Entomol. 2014;59:185-203. doi: 10.1146/annurev-ento-011613-162049. Epub 2013 Oct 18. Annu Rev Entomol. 2014. PMID: 24160428 Review.
-
Family level inbreeding depression and the evolution of plant mating systems.New Phytol. 2005 Jan;165(1):55-62. doi: 10.1111/j.1469-8137.2004.01184.x. New Phytol. 2005. PMID: 15720620 Review.
Cited by
-
Distinct effects of pollinator dependence and self-incompatibility on pollen limitation in South African biodiversity hotspots.Biol Lett. 2016 Jun;12(6):20160253. doi: 10.1098/rsbl.2016.0253. Epub 2016 Jun 8. Biol Lett. 2016. PMID: 27277954 Free PMC article.
-
Honeybees (Apis mellifera) decrease the fitness of plants they pollinate.Proc Biol Sci. 2023 Jun 28;290(2001):20230967. doi: 10.1098/rspb.2023.0967. Epub 2023 Jun 28. Proc Biol Sci. 2023. PMID: 37357853 Free PMC article.
-
Island plants with newly discovered reproductive traits have higher capacity for uniparental reproduction, supporting Baker's law.Sci Rep. 2024 May 18;14(1):11392. doi: 10.1038/s41598-024-62065-4. Sci Rep. 2024. PMID: 38762587 Free PMC article.
-
Differences in fine-scale spatial genetic structure across the distribution range of the distylous forest herb Pulmonaria officinalis (Boraginaceae).BMC Genet. 2013 Oct 18;14:101. doi: 10.1186/1471-2156-14-101. BMC Genet. 2013. PMID: 24134743 Free PMC article.
-
Genome skimming and microsatellite analysis reveal contrasting patterns of genetic diversity in a rare sandhill endemic (Erysimum teretifolium, Brassicaceae).PLoS One. 2020 May 27;15(5):e0227523. doi: 10.1371/journal.pone.0227523. eCollection 2020. PLoS One. 2020. PMID: 32459825 Free PMC article.
References
-
- Hamrick JL, Godt MJW. Effects of life history traits on genetic diversity in plant species. Philosophical Transactions of the Royal Society of London Series B, Biological Sciences. 1996;351:1291–1298. doi: 10.1098/rstb.1996.0112. - DOI
-
- Hamrick JL, Linhart YB, Mitton JB. Relationships between life history characteristics and electrophoretically detectable genetic variation in plants. Annual Review of Ecology and Systematics. 1979;10:173–200. doi: 10.1146/annurev.es.10.110179.001133. - DOI
-
- Loveless MD, Hamrick JL. Ecological determinants of genetic structure in plant populations. Annual Review of Ecology and Systematics. 1984;15:65–95. doi: 10.1146/annurev.es.15.110184.000433. - DOI
Publication types
MeSH terms
LinkOut - more resources
Full Text Sources
Research Materials
Miscellaneous
