Mycophenolate pharmacokinetics and pharmacodynamics in belatacept treated renal allograft recipients - a pilot study
- PMID: 19635156
- PMCID: PMC2724496
- DOI: 10.1186/1479-5876-7-64
Mycophenolate pharmacokinetics and pharmacodynamics in belatacept treated renal allograft recipients - a pilot study
Abstract
Background: Mycophenolic acid (MPA) is widely used as part of immunosuppressive regimens following allograft transplantation. The large pharmacokinetic (PK) and pharmacodynamic (PD) variability and narrow therapeutic range of MPA provide a potential for therapeutic drug monitoring. The objective of this pilot study was to investigate the MPA PK and PD relation in combination with belatacept (2nd generation CTLA4-Ig) or cyclosporine (CsA).
Methods: Seven renal allograft recipients were randomized to either belatacept (n = 4) or cyclosporine (n = 3) based immunosuppression. Samples for MPA PK and PD evaluations were collected predose and at 1, 2 and 13 weeks posttransplant. Plasma concentrations of MPA were determined by HPLC-UV. Activity of inosine monophosphate dehydrogenase (IMPDH) and the expressions of two IMPDH isoforms were measured in CD4+ cells by HPLC-UV and real-time reverse-transcription PCR, respectively. Subsets of T cells were characterized by flow cytometry.
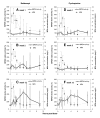
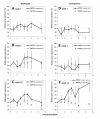
Results: The MPA exposure tended to be higher among belatacept patients than in CsA patients at week 1 (P = 0.057). Further, MPA concentrations (AUC0-9 h and C0) increased with time in both groups and were higher at week 13 than at week 2 (P = 0.031, n = 6). In contrast to the postdose reductions of IMPDH activity observed early posttransplant, IMPDH activity within both treatment groups was elevated throughout the dosing interval at week 13. Transient postdose increments were also observed for IMPDH1 expression, starting at week 1. Higher MPA exposure was associated with larger elevations of IMPDH1 (r = 0.81, P = 0.023, n = 7 for MPA and IMPDH1 AUC0-9 h at week 1). The maximum IMPDH1 expression was 52 (13-177)% higher at week 13 compared to week 1 (P = 0.031, n = 6). One patient showed lower MPA exposure with time and did neither display elevations of IMPDH activity nor IMPDH1 expression. No difference was observed in T cell subsets between treatment groups.
Conclusion: The significant influence of MPA on IMPDH1 expression, possibly mediated through reduced guanine nucleotide levels, could explain the elevations of IMPDH activity within dosing intervals at week 13. The present regulation of IMPDH in CD4+ cells should be considered when interpreting measurements of IMPDH inhibition.
Figures


Similar articles
-
Pharmacokinetics and pharmacodynamics of mycophenolic acid in stable renal transplant recipients treated with low doses of mycophenolate mofetil.Transpl Int. 2000;13 Suppl 1:S301-5. doi: 10.1007/s001470050348. Transpl Int. 2000. PMID: 11112019
-
Pharmacodynamic assessment of mycophenolic acid-induced immunosuppression in renal transplant recipients.Transplantation. 1996 Sep 15;62(5):666-72. doi: 10.1097/00007890-199609150-00022. Transplantation. 1996. PMID: 8830834 Clinical Trial.
-
Expression of IMPDH1 is regulated in response to mycophenolate concentration.Int Immunopharmacol. 2009 Feb;9(2):173-80. doi: 10.1016/j.intimp.2008.10.017. Epub 2008 Nov 20. Int Immunopharmacol. 2009. PMID: 19010451
-
Monitoring of inosine monophosphate dehydrogenase activity as a biomarker for mycophenolic acid effect: potential clinical implications.Ther Drug Monit. 2007 Apr;29(2):141-9. doi: 10.1097/FTD.0b013e31803d37b6. Ther Drug Monit. 2007. PMID: 17417067 Review.
-
[Optimal immunosuppressive therapy based on pharmacokinetics and pharmacodynamics of antimetabolites in clinical practice].Yakugaku Zasshi. 2010 Dec;130(12):1695-700. doi: 10.1248/yakushi.130.1695. Yakugaku Zasshi. 2010. PMID: 21139397 Review. Japanese.
Cited by
-
Belatacept for kidney transplant recipients.Cochrane Database Syst Rev. 2014 Nov 24;2014(11):CD010699. doi: 10.1002/14651858.CD010699.pub2. Cochrane Database Syst Rev. 2014. PMID: 25416857 Free PMC article.
-
Development of Simultaneous Drug Concentration Measurement Method Using an Automated Pretreatment Liquid Chromatography/Tandem Mass Spectrometry System for Therapeutic Drug Monitoring.Pharmaceutics. 2024 Aug 28;16(9):1138. doi: 10.3390/pharmaceutics16091138. Pharmaceutics. 2024. PMID: 39339175 Free PMC article.
-
Transition from cyclosporine-induced renal dysfunction to nephrotoxicity in an in vivo rat model.Int J Mol Sci. 2014 May 20;15(5):8979-97. doi: 10.3390/ijms15058979. Int J Mol Sci. 2014. PMID: 24853130 Free PMC article.
References
-
- Natsumeda Y, Ohno S, Kawasaki H, Konno Y, Weber G, Suzuki K. Two distinct cDNAs for human IMP dehydrogenase. J Biol Chem. 1990;265:5292–5295. - PubMed
-
- Dayton JS, Lindsten T, Thompson CB, Mitchell BS. Effects of human T lymphocyte activation on inosine monophosphate dehydrogenase expression. J Immunol. 1994;152:984–991. - PubMed
-
- Nagai M, Natsumeda Y, Konno Y, Hoffman R, Irino S, Weber G. Selective up-regulation of type II inosine 5'-monophosphate dehydrogenase messenger RNA expression in human leukemias. Cancer Res. 1991;51:3886–3890. - PubMed
MeSH terms
Substances
LinkOut - more resources
Full Text Sources
Medical
Research Materials

