. 2009 Jul 28:10:56.
doi: 10.1186/1471-2121-10-56.

Regulation of mitotic spindle formation by the RhoA guanine nucleotide exchange factor ARHGEF10

Affiliations

Regulation of mitotic spindle formation by the RhoA guanine nucleotide exchange factor ARHGEF10

Takuji Aoki et al. BMC Cell Biol. .

Abstract

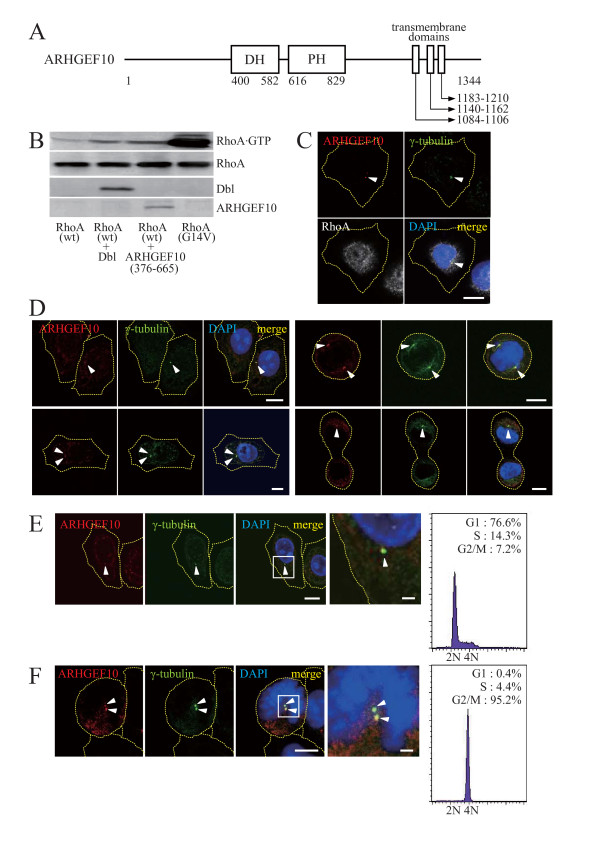
Background: The Dbl family guanine nucleotide exchange factor ARHGEF10 was originally identified as the product of the gene associated with slowed nerve-conduction velocities of peripheral nerves. However, the function of ARHGEF10 in mammalian cells is totally unknown at a molecular level. ARHGEF10 contains no distinctive functional domains except for tandem Dbl homology-pleckstrin homology and putative transmembrane domains.

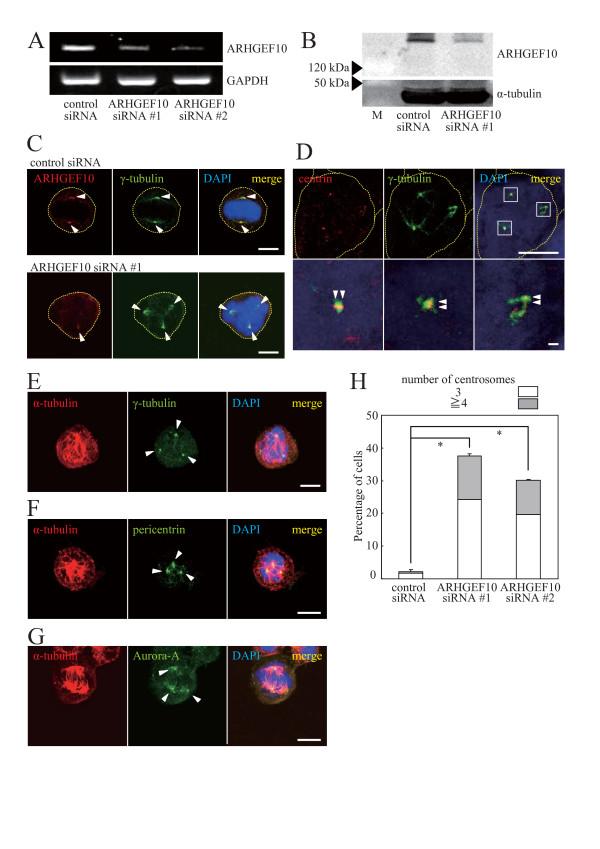
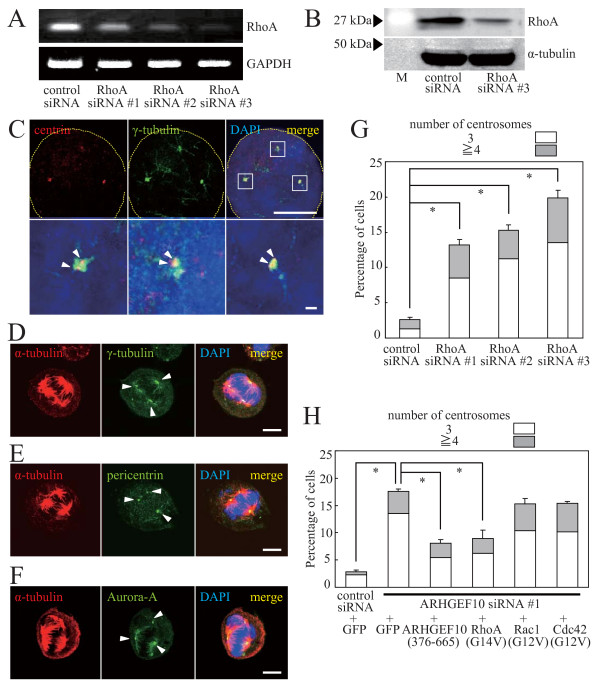
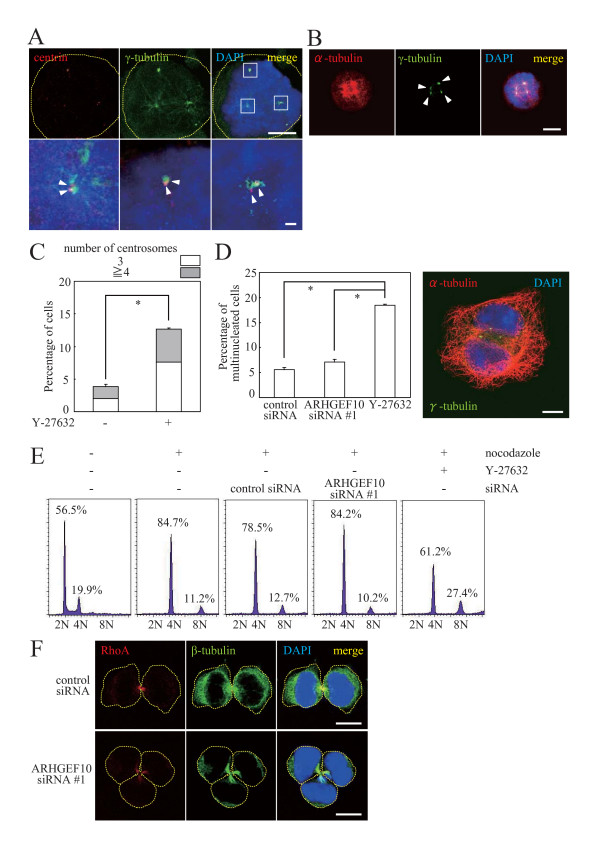
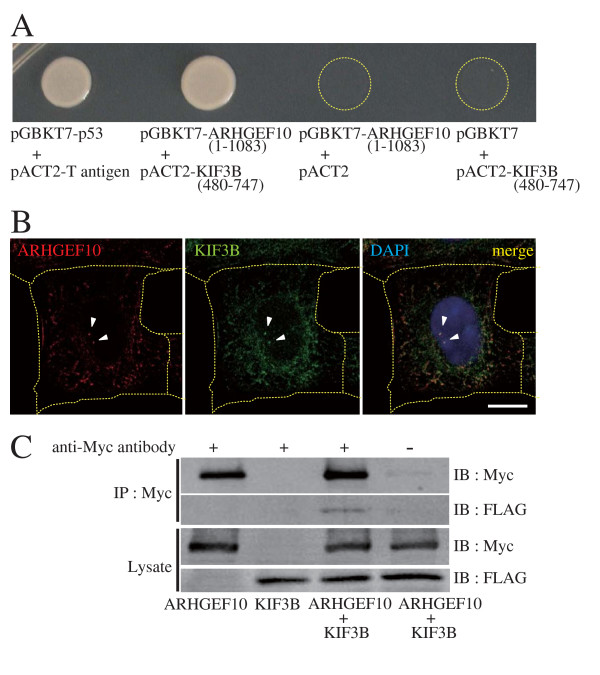
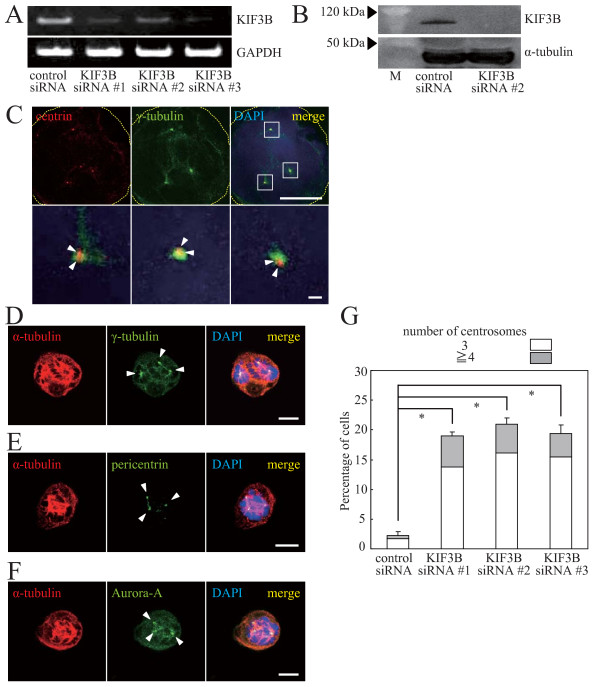
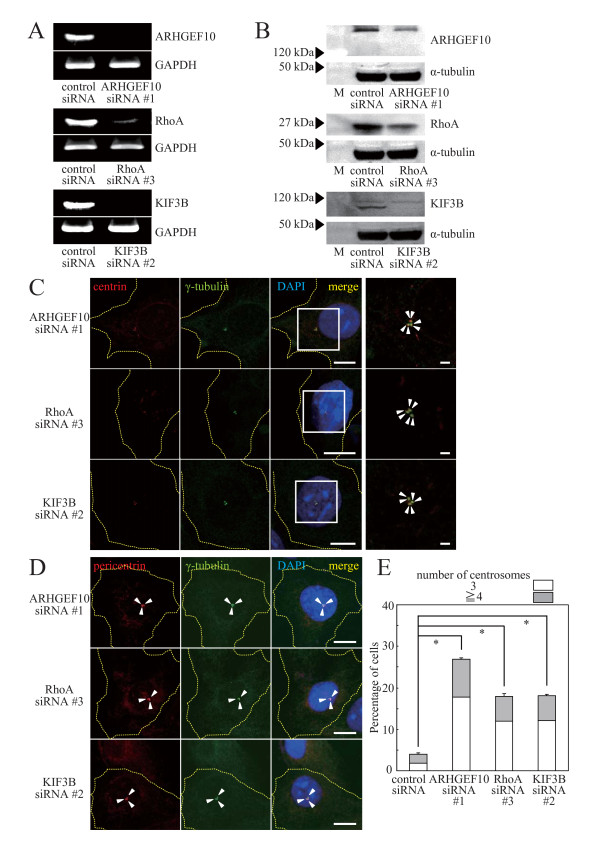
Results: Here we show that RhoA is a substrate for ARHGEF10. In both G1/S and M phases, ARHGEF10 was localized in the centrosome in adenocarcinoma HeLa cells. Furthermore, RNA interference-based knockdown of ARHGEF10 resulted in multipolar spindle formation in M phase. Each spindle pole seems to contain a centrosome consisting of two centrioles and the pericentriolar material. Downregulation of RhoA elicited similar phenotypes, and aberrant mitotic spindle formation following ARHGEF10 knockdown was rescued by ectopic expression of constitutively activated RhoA. Multinucleated cells were not increased upon ARHGEF10 knockdown in contrast to treatment with Y-27632, a specific pharmacological inhibitor for the RhoA effector kinase ROCK, which induced not only multipolar spindle formation, but also multinucleation. Therefore, unregulated centrosome duplication rather than aberration in cytokinesis may be responsible for ARHGEF10 knockdown-dependent multipolar spindle formation. We further isolated the kinesin-like motor protein KIF3B as a binding partner of ARHGEF10. Knockdown of KIF3B again caused multipolar spindle phenotypes. The supernumerary centrosome phenotype was also observed in S phase-arrested osteosarcoma U2OS cells when the expression of ARHGEF10, RhoA or KIF3B was abrogated by RNA interference.

Conclusion: Collectively, our results suggest that a novel RhoA-dependent signaling pathway under the control of ARHGEF10 has a pivotal role in the regulation of the cell division cycle. This pathway is not involved in the regulation of cytokinesis, but instead may regulate centrosome duplication. The kinesin-like motor protein KIF3B may modulate the ARHGEF10-RhoA pathway through the binding to ARHGEF10.


Figures

Figure 1
Figure 1
Substrate specificity and subcellular localization of ARHGEF10. (A) The domain structure of ARHGEF10. Amino acid residue numbers are shown. DH, Dbl homology; PH, pleckstrin homology. (B) GEF activity of ARHGEF10 toward RhoA. HA × 3-tagged wild-type (wt) or constitutively activated (G14V) RhoA was expressed with Myc-tagged Dbl or Myc-tagged ARHGEF10(376–665) in COS7 cells. Levels of the GTP-bound form were measured by pull-down assays using GST-Dia(1–304). Expression levels of RhoA and GEFs were determined by immunostaining with anti-tag antibodies. (C) Co-localization of ARHGEF10 and RhoA in centrosomes. HA × 3-tagged RhoA(wt) was expressed in HeLa cells, and indicated proteins were immunostained. Scale bar, 10 μm. (D) Subcellular localization of ARHGEF10 in unsynchronized cells. HeLa cells were cultivated in the growth medium, and indicated proteins were immunostained. Scale bar, 10 μm. (E) Subcellular localization of ARHGEF10 in G1/S phase. HeLa cells were synchronized in G1/S phase with thymidine, and indicated proteins were immunostained. The high magnification image of the boxed area in the 3rd panel is shown in the 4th panel. Scale bar, 10 μm (1st-3rd panels) and 2 μm (the 4th panel). Flow cytometric analysis of DNA content is also shown. (F) Subcellular localization of ARHGEF10 in M phase. HeLa cells were synchronized in M phase with nocodazole, and indicated proteins were immunostained. The high magnification image of the boxed area in the 3rd panel is shown in the 4th panel. Scale bar, 10 μm (1st-3rd panels) and 2 μm (the 4th panel). Flow cytometric analysis of DNA content is also shown. In (C) to (F), nuclei were stained with 4',6-diamidino-2-phenylindole (DAPI), and arrowheads indicate centrosomes. Thin dotted lines in cell images in (C) to (F) indicate the contour of the cell.
Figure 2
Figure 2
Multipolar spindle formation in ARHGEF10-knockdown HeLa cells. (A) Effect of ARHGEF10 siRNAs on mRNA expression. Expression levels of endogenous ARHGEF10 and GAPDH (control) mRNAs in HeLa cells transfected with indicated siRNAs were measured by RT-PCR. (B) Effect of ARHGEF10 siRNA #1 on protein expression. Expression levels of Myc-tagged ARHGEF10 and α-tubulin (control) in HeLa cells transfected with indicated siRNAs were measured by immunoblotting. M, molecular weight markers. (C) Subcellular localization of ARHGEF10 in M phase. HeLa cells were transfected with ARHGEF10 siRNA #1 or control siRNA and synchronized in M phase with nocodazole. Indicated proteins were immunostained. Scale bar, 10 μm. (D) Immunostaining of centrin and γ-tubulin in ARHGEF10-knockdown cells. HeLa cells were transfected with ARHGEF10 siRNA #1 and synchronized in M phase with nocodazole. Indicated proteins were immunostained. High magnification images of boxed areas are shown in lower panels. Scale bar, 10 μm (upper panels) and 1 μm (lower panels). (E) Immunostaining of α-tubulin and γ-tubulin in ARHGEF10-knockdown cells. Indicated proteins in HeLa cells treated as in (D) were immunostained. Scale bar, 10 μm. (F) Immunostaining of α-tubulin and pericentrin in ARHGEF10-knockdown cells. Indicated proteins in HeLa cells treated as in (D) were immunostained. Scale bar, 10 μm. (G) Immunostaining of α-tubulin and Aurora-A in ARHGEF10-knockdown cells. Indicated proteins in HeLa cells treated as in (D) were immunostained. Scale bar, 10 μm. (H) Quantification of multipolar spindle formation in ARHGEF10-knockdown cells. HeLa cells were transfected with indicated siRNAs and synchronized in M phase with nocodazole. The percentage of cells containing multiple centrosomes are shown as the means ± S.E. for three independent experiments. *, P < 0.01. In (C) to (G), nuclei were stained with DAPI, and arrowheads indicate centrosomes (C, E, F and G) or centrioles (D). Thin dotted lines in cell images in (C) and (D) indicate the contour of the cell.
Figure 3
Figure 3
Role of RhoA downstream of ARHGEF10. (A) Effect of RhoA siRNAs on mRNA expression. Expression levels of endogenous RhoA and GAPDH (control) mRNAs in HeLa cells transfected with indicated siRNAs were measured by RT-PCR. (B) Effect of RhoA siRNA #3 on protein expression. Expression levels of HA × 3-tagged RhoA(wt) and α-tubulin (control) in HeLa cells transfected with indicated siRNAs were measured by immunoblotting. M, molecular weight markers. (C) Immunostaining of centrin and γ-tubulin in RhoA-knockdown cells. HeLa cells were transfected with RhoA siRNA #2 and synchronized in M phase with nocodazole. Indicated proteins were immunostained. High magnification images of boxed areas are shown in lower panels. Scale bar, 10 μm (upper panels) and 1 μm (lower panels). (D) Immunostaining of α-tubulin and γ-tubulin in RhoA-knockdown cells. Indicated proteins in HeLa cells treated as in (C) were immunostained. Scale bar, 10 μm. (E) Immunostaining of α-tubulin and pericentrin in RhoA-knockdown cells. Indicated proteins in HeLa cells treated as in (C) were immunostained. Scale bar, 10 μm. (F) Immunostaining of α-tubulin and Aurora-A in RhoA-knockdown cells. Indicated proteins in HeLa cells treated as in (C) were immunostained. Scale bar, 10 μm. (G) Quantification of multipolar spindle formation in RhoA-knockdown cells. HeLa cells were transfected with indicated siRNAs and synchronized in M phase with nocodazole. The percentage of cells containing multiple centrosomes are shown as the means ± S.E. for three independent experiments. *, P < 0.01. (H) Suppression of multipolar spindle formation in ARHGEF10-knockdown cells by RhoA. HeLa cells transfected with ARHGEF10 siRNA #1 or control siRNA in combination with an expression plasmid for green fluorescent protein (GFP) (control), Myc-tagged ARHGEF10(376–665) or HA × 3-tagged constitutively activated GTPases were synchronized in M phase with nocodazole. The percentage of cells containing multiple centrosomes are shown as the means ± S.E. for three independent experiments. *, P < 0.01. In (C) to (F), nuclei were stained with DAPI, and arrowheads indicate centrioles (C) or centrosomes (D, E and F). Thin dotted lines in cell images in (C) indicate the contour of the cell.
Figure 4
Figure 4
Multinucleation in Y-27632-treated, but not ARHGEF10-knockdown, HeLa cells. (A) Immunostaining of centrin and γ-tubulin in Y-27632-treated cells. HeLa cells were treated with Y-27632 for 4 h and synchronized in M phase with nocodazole. Indicated proteins were immunostained. High magnification images of boxed areas are shown in lower panels. Scale bar, 10 μm (upper panels) and 1 μm (lower panels). (B) Immunostaining of α-tubulin and γ-tubulin in Y-27632-treated cells. Indicated proteins in HeLa cells treated as in (A) were immunostained. Scale bar, 10 μm. (C) Quantification of multipolar spindle formation in Y-27632-treated cells. HeLa cells were treated with Y-27632 for 4 h and synchronized in M phase with nocodazole. The percentage of cells containing multiple centrosomes are shown as the means ± S.E. for three independent experiments. *, P < 0.01. (D) Increase of multinucleated cells upon Y-27632 treatment, but not ARHGEF10 knockdown. HeLa cells were transfected with ARHGEF10 siRNA #1 or treated with Y-27632 for 48 h and synchronized in M phase with nocodazole. Multinucleated cells as shown in the right panel were counted after 4 h-incubation without nocodazole. The percentage of multinucleated cells are shown as the means ± S.E. for three independent experiments. *, P < 0.01. Scale bar, 10 μm. (E) Flow cytometric analysis of DNA content in ARHGEF10-knockdown and Y-27632-treated HeLa cells. Representative fluorescence-activated cell sorter histograms and the percentage of cells contained in each peak are shown. (F) Cytokinesis of ARHGEF10-knockdown cells. HeLa cells were transfected with ARHGEF10 siRNA #1 or control siRNA in combination with an expression plasmid for HA × 3-tagged RhoA(wt) and synchronized in M phase with nocodazole. Indicated proteins were immunostained after 3 h-incubation without nocodazole. Representative cells during cytokinesis are shown. Scale bar, 10 μm. In (A), (B), (D) and (F), nuclei were stained with DAPI, and arrowheads indicate centrioles (A) or centrosomes (B). Thin dotted lines in cell images in (A) and (F) indicate the contour of the cell.
Figure 5
Figure 5
Interaction of KIF3B with ARHGEF10. (A) Yeast two-hybrid interaction of KIF3B with ARHGEF10. cDNAs for ARHGEF10(1–1083) and KIF3B(480–747) were subcloned into yeast two-hybrid vectors pGBKT7 and pACT2, respectively, and two-hybrid interaction was assessed by growth on the selection plate (synthetic dropout medium-Trp/-Leu/-His/-Ade/+2.5 mM 3-aminotriazole). pGBKT7-p53 and pACT2-T antigen were used as a positive control. (B) Co-localization of ARHGEF10 and KIF3B in HeLa cells. HeLa cells were transfected with an expression plasmid for FLAG-tagged KIF3B, and indicated proteins were immunostained. Arrowheads indicate centrosomes. Scale bar, 10 μm. Thin dotted lines indicate the contour of the cell. (C) Co-immunoprecipitation of KIF3B with ARHGEF10. Myc-tagged ARHGEF10 and FLAG-tagged KIF3B were expressed in COS7 cells as indicated, and association of these proteins was examined by co-immunoprecipitation. IP, immunoprecipitation; IB, immunoblotting.
Figure 6
Figure 6
Multipolar spindle formation in KIF3B-knockdown HeLa cells. (A) Effect of KIF3B siRNAs on mRNA expression. Expression levels of endogenous KIF3B and GAPDH (control) mRNAs in HeLa cells transfected with indicated siRNAs were measured by RT-PCR. (B) Effect of KIF3B siRNA #2 on protein expression. Expression levels of FLAG-tagged KIF3B and α-tubulin (control) in HeLa cells transfected with indicated siRNAs were measured by immunoblotting. M, molecular weight markers. (C) Immunostaining of centrin and γ-tubulin in KIF3B-knockdown cells. HeLa cells were transfected with KIF3B siRNA #2 and synchronized in M phase with nocodazole. Indicated proteins were immunostained. High magnification images of boxed areas are shown in lower panels. Scale bar, 10 μm (upper panels) and 1 μm (lower panels). (D) Immunostaining of α-tubulin and γ-tubulin in KIF3B-knockdown cells. Indicated proteins in HeLa cells treated as in (C) were immunostained. Scale bar, 10 μm. (E) Immunostaining of α-tubulin and pericentrin in KIF3B-knockdown cells. Indicated proteins in HeLa cells treated as in (C) were immunostained. Scale bar, 10 μm. (F) Immunostaining of α-tubulin and Aurora-A in KIF3B-knockdown cells. Indicated proteins in HeLa cells treated as in (C) were immunostained. Scale bar, 10 μm. (G) Quantification of multipolar spindle formation in KIF3B-knockdown cells. HeLa cells were transfected with indicated siRNAs and synchronized in M phase with nocodazole. The percentage of cells containing multiple centrosomes are shown as the means ± S.E. for three independent experiments. *, P < 0.01. In (C) to (F), nuclei were stained with DAPI, and arrowheads indicate centrioles (C) or centrosomes (D, E and F). Thin dotted lines in cell images in (C) indicate the contour of the cell.
Figure 7
Figure 7
Supernumerary centrosomes in aphidicolin-treated U2OS cells. (A) Effect of siRNAs for ARHGEF10, RhoA and KIF3B on mRNA expression. Expression levels of ARHGEF10, RhoA, KIF3B and GAPDH (control) mRNAs in U2OS cells transfected with indicated siRNAs were measured by RT-PCR. (B) Effect of siRNAs for ARHGEF10, RhoA and KIF3B on protein expression. Expression levels of Myc-tagged ARHGEF10, HA × 3-tagged RhoA(wt), FLAG-tagged KIF3B and α-tubulin (control) in U2OS cells transfected with indicated siRNAs were measured by immunoblotting. M, molecular weight markers. (C) Immunostaining of centrin and γ-tubulin in ARHGEF10-, RhoA- and KIF3B-knockdown cells. U2OS cells were transfected with ARHGEF10 siRNA #1, RhoA siRNA #3 or KIF3B siRNA #2 and synchronized in S phase with aphidicolin. Indicated proteins were immunostained. High magnification images of boxed areas are shown in right panels. Scale bar, 2 μm (right panels) and 10 μm (other panels). (D) Immunostaining of pericentrin and γ-tubulin in ARHGEF10-, RhoA- and KIF3B-knockdown cells. Indicated proteins in U2OS cells treated as in (C) were immunostained. Scale bar, 10 μm. (E) Quantification of supernumerary centrosomes in ARHGEF10-, RhoA- and KIF3B-knockdown cells. U2OS cells were transfected with indicated siRNAs and synchronized in S phase with aphidicolin. The percentage of cells containing multiple centrosomes are shown as the means ± S.E. for three independent experiments. *, P < 0.01. In (C) and (D), nuclei were stained with DAPI, and arrowheads indicate centrioles (C) or centrosomes (D). Thin dotted lines in cell images in (C) and (D) indicate the contour of the cell.

Similar articles

Cited by

References

    1. Doxsey S. Re-evaluating centrosome function. Nat Rev Mol Cell Biol. 2001;2:688–698. doi: 10.1038/35089575. - DOI - PubMed
    1. Hinchcliffe EH, Sluder G. "It takes two to tango": understanding how centrosome duplication is regulated throughout the cell cycle. Genes Dev. 2001;15:1167–1181. doi: 10.1101/gad.894001. - DOI - PubMed
    1. Nigg EA. Centrosome aberrations: cause or consequence of cancer progression? Nat Rev Cancer. 2002;2:815–825. doi: 10.1038/nrc924. - DOI - PubMed
    1. Schmidt A, Hall A. Guanine nucleotide exchange factors for Rho GTPases: turning on the switch. Genes Dev. 2002;16:1587–1609. doi: 10.1101/gad.1003302. - DOI - PubMed
    1. Piekny A, Werner M, Glotzer M. Cytokinesis: welcome to the Rho zone. Trends Cell Biol. 2005;15:651–658. doi: 10.1016/j.tcb.2005.10.006. - DOI - PubMed

Publication types