. 2010 Jan 1;49(1):525-38.
doi: 10.1016/j.neuroimage.2009.07.043. Epub 2009 Jul 25.

Investigating spatial specificity and data averaging in MEG

Affiliations

Investigating spatial specificity and data averaging in MEG

Matthew J Brookes et al. Neuroimage. .

Abstract

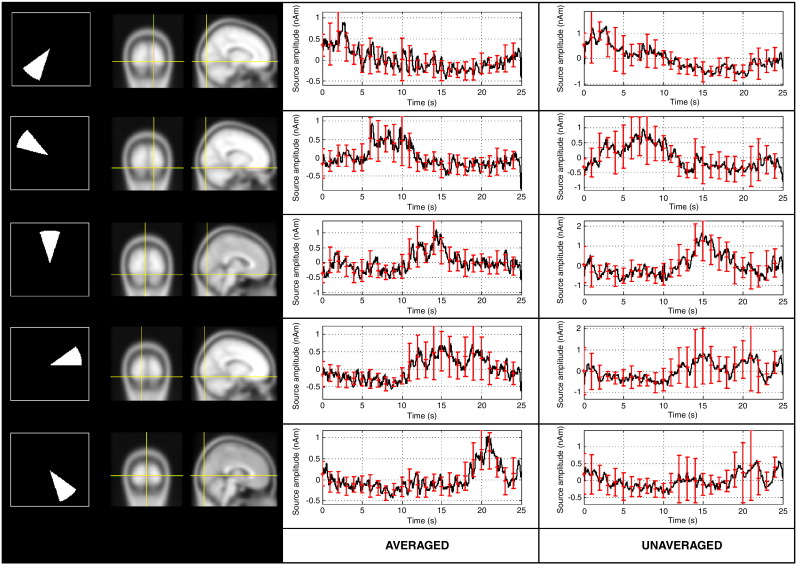
This study shows that the spatial specificity of MEG beamformer estimates of electrical activity can be affected significantly by the way in which covariance estimates are calculated. We define spatial specificity as the ability to extract independent timecourse estimates of electrical brain activity from two separate brain locations in close proximity. Previous analytical and simulated results have shown that beamformer estimates are affected by narrowing the time frequency window in which covariance estimates are made. Here we build on this by both experimental validation of previous results, and investigating the effect of data averaging prior to covariance estimation. In appropriate circumstances, we show that averaging has a marked effect on spatial specificity. However the averaging process results in ill-conditioned covariance matrices, thus necessitating a suitable matrix regularisation strategy, an example of which is described. We apply our findings to an MEG retinotopic mapping paradigm. A moving visual stimulus is used to elicit brain activation at different retinotopic locations in the visual cortex. This gives the impression of a moving electrical dipolar source in the brain. We show that if appropriate beamformer optimisation is applied, the moving source can be tracked in the cortex. In addition to spatial reconstruction of the moving source, we show that timecourse estimates can be extracted from neighbouring locations of interest in the visual cortex. If appropriate methodology is employed, the sequential activation of separate retinotopic locations can be observed. The retinotopic paradigm represents an ideal platform to test the spatial specificity of source localisation strategies. We suggest that future comparisons of MEG source localisation techniques (e.g. beamformer, minimum norm, Bayesian) could be made using this retinotopic mapping paradigm.


Figures

Fig. A1
Fig. A1
Schematic diagram showing the change in the range of singular values caused by data averaging prior to covariance matrix computation. Note that in both cases, the least significant singular value will underestimate white noise level, however, this underestimation will be far more pronounced in the averaged case.
Fig. A2
Fig. A2
(A) Reconstructed power in the active and control covariance windows versus covariance window duration. (B) Difference in power between active and control windows. Results are averaged across all subjects and two locations.
Fig. 1
Fig. 1
Results of the single source simulation. (A) ΔCF versus Nave. The solid line shows the theoretical relationship (Eq. (6)) and the data points show values from the simulation. (B) ΔCinvF versus Nave for the unregularised covariance matrix. (C) ΔCinvF versus Nave for the regularised covariance matrix. Note the × 10− 4 scaling on the y-axis. (D) Beamformer projected power for the ON (blue) and OFF (green) periods. E) One dimensional beamformer pseudo-T-stat images extracted from a single interaction of the simulation. Images were formed in this case by scanning in the y direction but equivalent results were derived for both the x and z directions.
Fig. 2
Fig. 2
Results of the two source simulations with Gaussian random noise. (A) beamformer reconstructed power in the ON (blue) and OFF (green) periods reconstructed at the location of source 1. Results are plotted against Nave (B) timecourse correlation. The blue data points show the Pearson correlation coefficient between the beamformer timecourse estimate made at the location of source 1, and the original simulated timecourse for source 1. The green data points show the Pearson correlation coefficient between the beamformer timecourse estimate made at the location of source 1, and the original simulated timecourse for source 2. (C) Example 1-dimensional images, from a single iteration of the simulation, showing the pseudo-T-statistic as a function of position, y. Source 1 is at y = 1. Source 2 is at y = 0. Note for A, B and C, the amplitudes of sources 1 and 2 were 5 nAm and 10 nAm respectively.
Fig. 3
Fig. 3
Results of the two source simulation with Q1 = 5 nAm, Q2 = 10 nAm, and experimentally measured noise. (A) beamformer reconstructed power in the ON (blue) and OFF (green) periods reconstructed at the location of source 1. Results are plotted against Nave (B) timecourse correlation. The blue data points show the Pearson correlation coefficient between the beamformer timecourse estimate made at the location of source 1, and the original simulated timecourse for source 1. The green data points show the Pearson correlation coefficient between the beamformer timecourse estimate made at the location of source 1, and the original simulated timecourse for source 2. (C) Example 1-dimensional images, from a single iteration of the simulation, showing the pseudo-T-statistic as a function of position, y. Source 1 is at y = 1. Source 2 is at y = 0.
Fig. 4
Fig. 4
Results of the retinotopic mapping experiment taken from a single subject and derived using averaged data. The left hand column shows pseudo-T-statistical images (derived from averaged data) depicting the retinotopic location of the source. Covariance windows were centred on 2.5 s, 7.5 s, 12.5 s, 17.5 s, and 22.5 s. The location of the stimulus in the visual field at these times is shown inset. The centre and right hand columns show the timecourse estimates of the envelope of 18–22 Hz power. These estimates were taken from peak locations in the images. Timecourses in the centre column are reconstructed using beamformer weights based on averaged data. Timecourses in the right hand column are reconstructed using beamformer weights based on unaveraged data.
Fig. 5
Fig. 5
Results averaged across subjects. The left hand column shows averaged locations for each stimulus location. The centre and right hand columns show timecourse estimates reconstructed using beamformer weights based on averaged and unaveraged data respectively. These timecourses are averaged across subjects and error bars show standard deviation.
Fig. 6
Fig. 6
Pearson correlation between the data derived timecourses and the sequential activation model.

Similar articles

Cited by

References

    1. Aine C.J., Supek S., George J.S., Ranken D., Lewine J., Sanders J., Best E., Tiee W., Flynn E.R., Wood C.C. Retinotopic organization of human visual cortex: departures from the classical model. Cereb. Cortex. 1996;6:354–361. - PubMed
    1. Barnes G.R., Hillebrand A. Statistical flattening of beamformer images. Hum. Brain Mapp. 2003;18:1–12. - PMC - PubMed
    1. Brookes M.J., Stevenson C.M., Barnes G.R., Hillebrand A., Simpson M.I.G., Francis S.T., Morris P.G. Beamformer reconstruction of correlated sources using a modified source model. NeuroImage. 2007;34:1454–1465. - PubMed
    1. Brookes M.J., Vrba J., Robinson S.E., Stevenson C.M., Peters A.P., Barnes G.R., Hillebrand A., Morris P.G. Optimising experimental design for MEG beamformer imaging. NeuroImage. 2008;39:1788–1802. - PubMed
    1. Cheyne D., Bakhtazad L., Gaetz W. Spatiotemporal mapping of cortical activity accompanying voluntary movements using an event-related beamforming approach. Hum. Brain Mapp. 2006;27:213–229. - PMC - PubMed

Publication types

LinkOut - more resources