. 2009 Sep 18;284(38):25664-77.
doi: 10.1074/jbc.M109.014241. Epub 2009 Jul 27.

c-Cbl tyrosine kinase-binding domain mutant G306E abolishes the interaction of c-Cbl with CD38 and fails to promote retinoic acid-induced cell differentiation and G0 arrest

Affiliations

c-Cbl tyrosine kinase-binding domain mutant G306E abolishes the interaction of c-Cbl with CD38 and fails to promote retinoic acid-induced cell differentiation and G0 arrest

Miaoqing Shen et al. J Biol Chem. .

Abstract

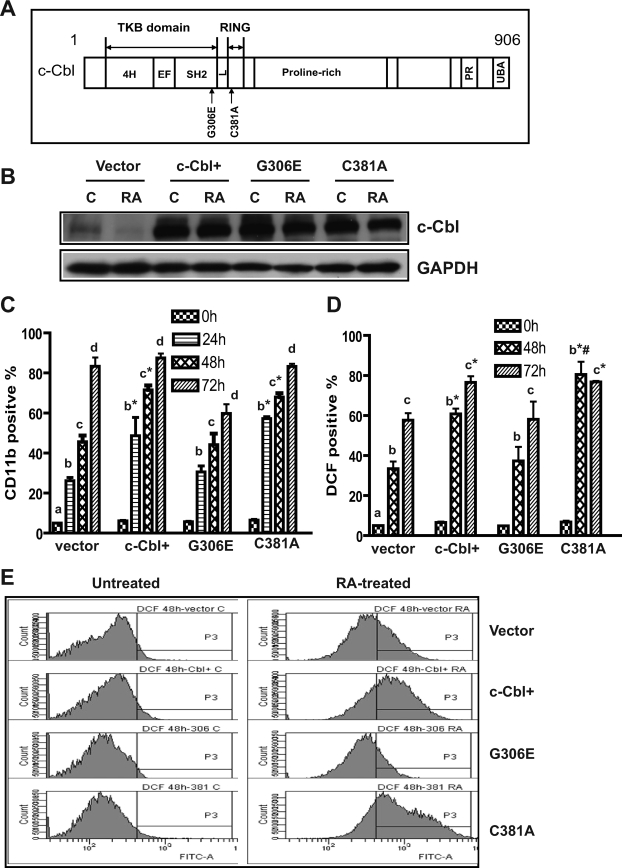
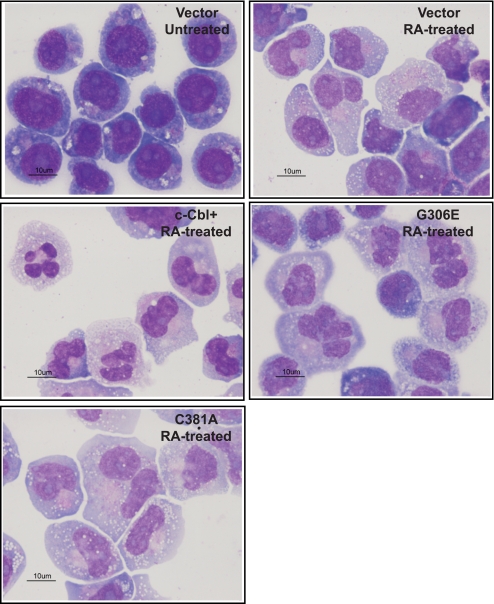
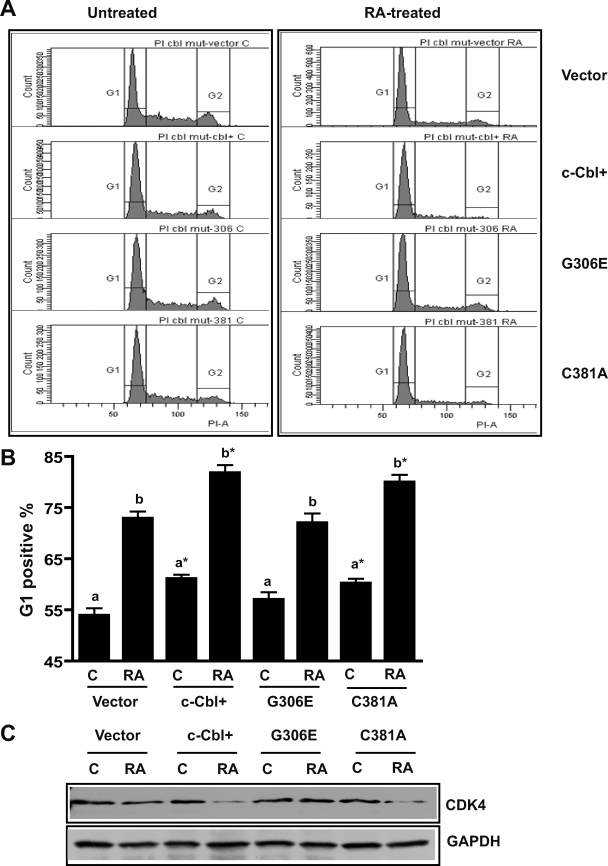
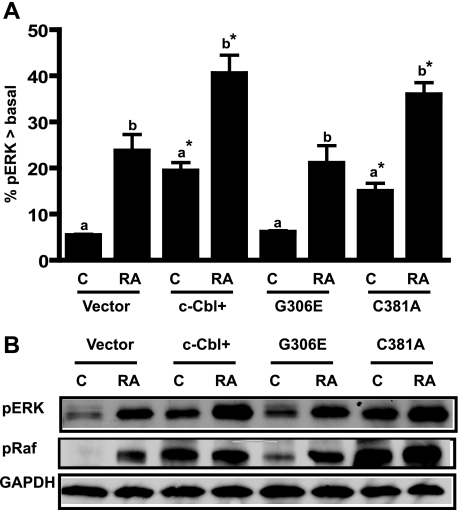
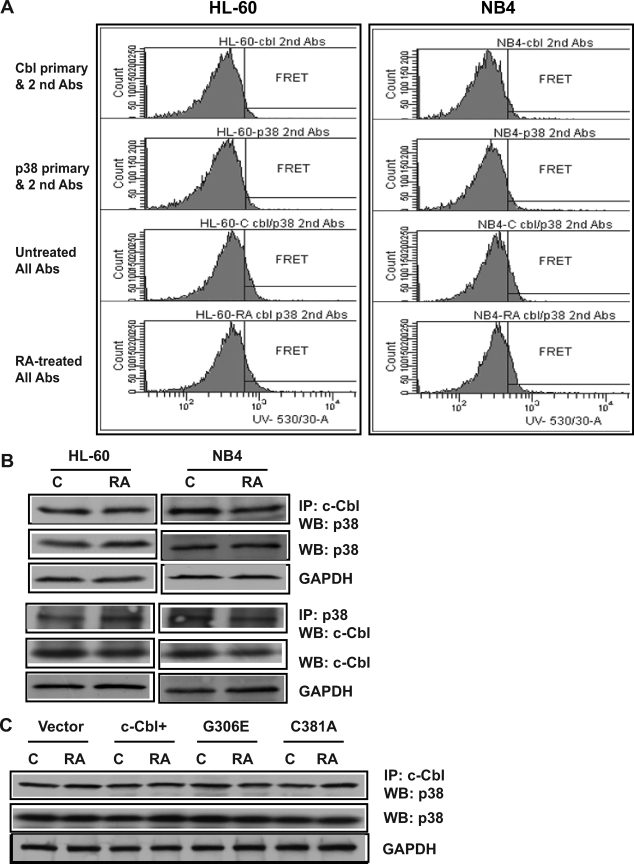
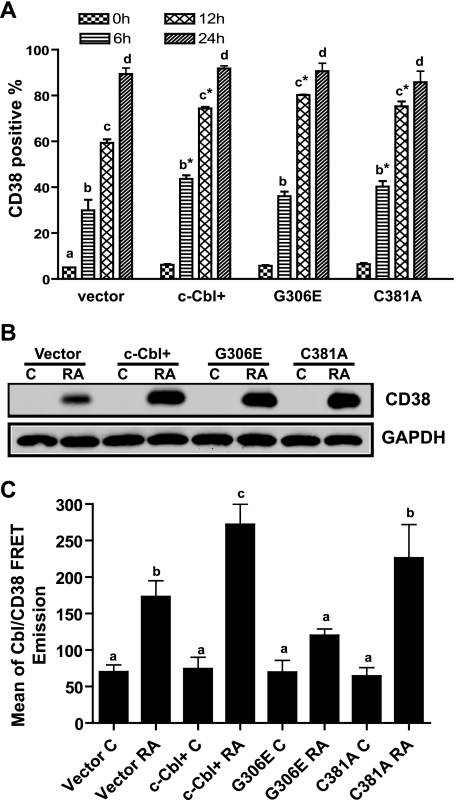
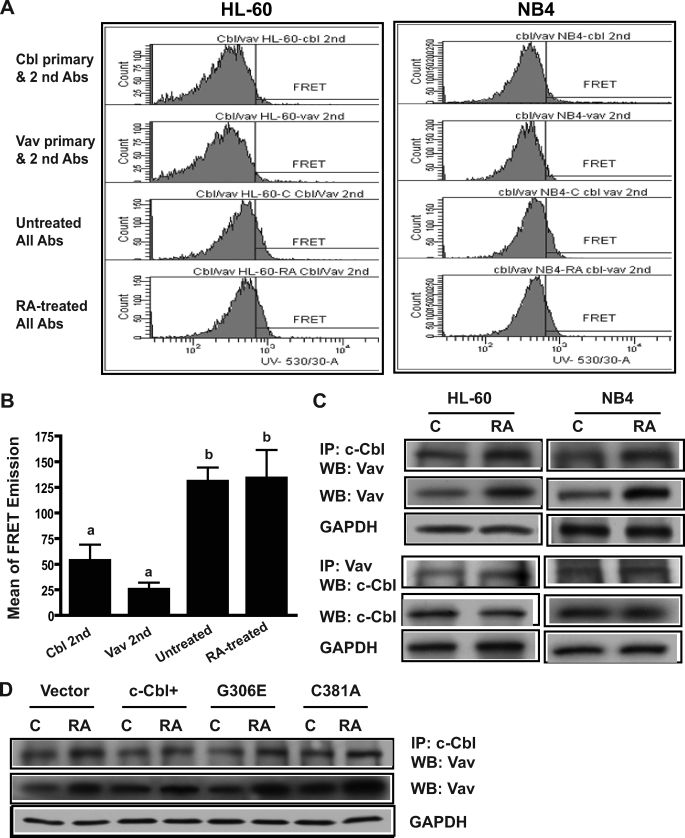
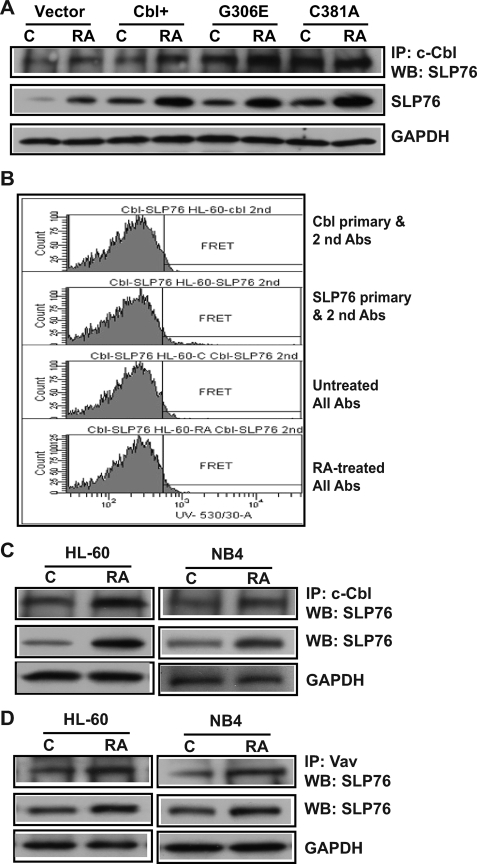
Retinoic acid (RA) causes HL-60 human myeloblastic leukemia cell myeloid differentiation that is dependent on MAPK signaling. The process is propelled by c-Cbl, which binds the CD38 receptor as part of a signaling complex generating MAPK signaling. Here we report that the capability of c-Cbl to do this is lost in the G306E tyrosine kinase-binding domain mutant. Unlike wild-type (WT) c-Cbl, the G306E mutant c-Cbl fails to propel RA-induced differentiation, and disrupts the normal association with CD38. The G306E mutant does, like WT c-Cbl, co-immunoprecipitate with Vav, Slp-76, and p38. But unlike WT c-Cbl, does not cause MAPK signaling. In contrast, the C381A Ring finger domain mutant functions like WT c-Cbl. It binds CD38 and is part of the same apparent c-Cbl/Slp-76/Vav/p38 signaling complex. The C381A mutant causes MAPK signaling and propels RA-induced differentiation. In addition to HL-60 cells and their WT or mutant c-Cbl stable transfectants, the c-Cbl/Vav/Slp-76 complex is also found in NB4 cells where c-Cbl was previously also found to bind CD38. The data are consistent with a model in which the G306E mutant c-Cbl forms a signaling complex that includes Slp-76, Vav, and p38; but does not drive MAPK signaling because it fails to bind the CD38 receptor. Without the G306E mutation the c-Cbl unites CD38 with the signaling complex and delivers a MAPK signal that drives RA-induced differentiation. The results demonstrate the importance of the Gly306 residue in the ability of c-Cbl to propel RA-induced differentiation.


Figures

FIGURE 1.
FIGURE 1.
c-Cbl TKB mutant failed to enhance CD11b expression and RA-induced cell differentiation compared with WT c-Cbl stably transfected cells (c-Cbl+). A, diagrammatic representation of the major domains of c-Cbl and mutations within the TKB and Ring finger domains used in this study. The c-Cbl protein consists of the TKB, the Ring finger domain (RING), proline-rich region, a PX(P/A)XXR motif (PR), and a ubiquitin-associated domain (UBA) at its C terminus. The TKB domain containing a four-helix bundle (4H), EF-hand calcium binding, and a variant SH2 domain is separated from the RING domain by a short linker (L) region. B, in stably transfected cells WT c-Cbl (c-Cbl+) or two c-Cbl mutants (G306E and C381A) were strongly overexpressed compared with c-Cbl in vector control cells. G306E and C381A were transfected into HL-60 cells. Western blots of c-Cbl (upper) and GAPDH (lower) expression in vector control, c-Cbl+, and G306E and C381C stable transfectant cells were untreated control (C) or RA treated (RA, 48 h). C, compared with vector controls, c-Cbl+ and C381A transfectants showed significantly enhanced expression of CD11b after RA treatment; however, the G306E mutant did not. Vector controls, WT c-Cbl, G306E, and C381A stable transfectants were treated with RA for the indicated times, and stained with allophycocyanin-conjugated anti-CD11b antibody. Bars are means ± S.E. of 3 repeats. D, RA-induced expression of the functional differentiation marker inducible oxidative metabolism was accelerated by WT c-Cbl and the C381A mutant, but not the G306E mutant. Vector control, c-Cbl+, G306E, and C381A stable transfectants were treated with RA for the indicated times, and the percentage of cells capable of inducible oxidation metabolism detected by 2′,7′-dichlorohydrofluorescein diacetate (DCF) fluorescence was analyzed by flow cytometry. E, representative DCF fluorescence histograms of untreated and (48 h) RA-treated vector control, WT c-Cbl, G306E, and C381A stable transfectants. The different letters indicate different time points. Asterisk indicates that CD11b or DCF expression levels from WT c-Cbl and C381A transfectants were significantly (p ≤ 0.05) different from vector controls and G306E transfectants. # denotes that C381A transfectants were significantly (p ≤ 0.05) different from c-Cbl+ transfectants.
FIGURE 2.
FIGURE 2.
Cytological observation of Wrights-stained untreated cells, and RA-treated vector control, c-Cbl+, G306E, and C381A stable transfectants. Cells were treated with 1.0 μm RA for 4 days and stained with Wrights stain. More than 50 cells were inspected, and images were taken using the ×100 objective. Cytological data are consistent with differentiation assays.
FIGURE 3.
FIGURE 3.
c-Cbl G306E failed to promote RA-induced cell cycle arrest. A, representative DNA histograms of untreated and (72 h) RA-treated vector control, c-Cbl+, G306E, and C381A stable transfectants. B, percentage of vector control, c-Cbl+, G306E, and C381A transfectant cells with G1/G0 DNA after a 72-h RA treatment. Cells stained with hypotonic propidium iodine (PI) staining solution were analyzed by flow cytometry. Bars represent means ± S.E. of 8 repeats. The different letters indicate significant differences at the p ≤ 0.05 levels between untreated (C) and RA treated (RA) among the same cell lines. Asterisk indicates a significant (p ≤ 0.05) difference compared with vector control cells. C, Western blots of CDK4 for vector control, c-Cbl+, G306E, and C381A stable transfectants. The WT c-Cbl and the C381A transfectants had less CDK4 expression than vector control or G306E transfectants after RA treatment (72 h). GAPDH was used to check protein loading. The data from the CDK4 Western blots were consistent with G1/0 arrest assays, indicating that the G306E mutant failed to promote cell cycle arrest.
FIGURE 4.
FIGURE 4.
c-Cbl TKB mutant G306E failed to increase RAF/ERK activation. A, percentage of cells with pERK exceeding basal levels in vector control, c-Cbl+, and G306E or C381A mutant stable transfectants that were untreated (C) or RA treated. Ectopic high expression of c-Cbl or mutant C381A enhanced activated ERK expression; however, the G306E mutant did not. Induced ERK activation upon RA treatment for 24 h was indicated by a shift in the percentage of cells with activated ERK above the basal levels of control cells. Bars represent means ± S.E. of 3 repeats. The different letters indicate a significant difference (p ≤ 0.05) between untreated and RA treated among the same cell lines. Asterisks indicates a significant (p ≤ 0.05) difference compared with untreated (a) or RA-treated (b) vector control cells. B, Western blots of activated phospho-ERK and phospho-RAF for vector control, c-Cbl+, G306E, and C381A transfectants. GAPDH was used to check protein loading. RA treatment was for 24 h. The data from Western blots were consistent with flow cytometry results, indicating that c-Cbl+ and C381A enhanced activated ERK expression, but G306E mutant did not.
FIGURE 5.
FIGURE 5.
The G306E c-Cbl mutation did not affect p38 binding or expression. A, representative histograms of FRET signals of untreated and (24 h) RA-treated HL-60 and NB4 cells. c-Cbl and p38 interaction was observed in both HL-60 and NB4 cells. Cells fixed in paraformaldehyde and permeabilized were incubated in PBS containing mouse anti-c-Cbl and rabbit anti-p38 primary antibodies and then stained with Alexa 350- and 430-conjugated goat anti-mouse and goat anti-rabbit secondary antibodies. B, p38 or c-Cbl were co-immunoprecipitated in both HL-60 and NB4 cells. Co-IP using anti-c-Cbl or anti-p38 antibody pulled down c-Cbl or p38 from protein lysates of WT-HL60 and NB4 (untreated and RA-treated for 24 h) and Western blotted (WB) using anti-p38 or anti-c-Cbl. Nonspecific immunoglobulin was used as a negative control and no signal was detected. Western blots of total protein lysates show the expression levels of p38 or c-Cbl in untreated or RA-treated HL-60 or NB4 cells. Anti-GAPDH was used to show consistently the input of total cellular proteins in the co-IP reactions. C, c-Cbl was immunoprecipitated from protein lysates of vector control, c-Cbl+, G306E, and C381A transfectants and probed for p38 in Western blots. Total cell lysates from different transfectants were also Western blotted with p38 to check p38 expression.
FIGURE 6.
FIGURE 6.
c-Cbl G306E TBK mutant disrupted the binding between c-Cbl and CD38. A, percentage of vector control, WT c-Cbl, G306E, and C381A transfectants expressing CD38 after RA treatment for the indicated times. RA-treated c-Cbl+, G306E, and C381A transfectants had increased expression of CD38 compared with vector controls. The different letters indicate significant (p ≤ 0.05) differences at different treated times. Asterisks indicate that CD38 expression levels from c-Cbl+, G306E, and C381A transfectants were significantly (p ≤ 0.05) different from vector controls. B, Western blot of CD38 for vector control, c-Cbl+, G306E, and C381A stable transfectants (upper panel). GAPDH (lower panel) was used to check protein loading. The RA treatment is for 12 h. The data from Western blots were consistent with flow cytometry results. C, the FRET signals between c-Cbl and CD38 for control and RA-treated vector control cells, c-Cbl+, and mutant G306E and C381A transfectants. The FRET signal from RA-treated G306E transfectants was significantly lower than that from vector control, WT c-Cbl, or C381A transfectants. The different letters indicate significant differences between untreated and other groups of cells. Bars represent means ± S.E. of 3 repeats.
FIGURE 7.
FIGURE 7.
The interaction of c-Cbl G306E and C381A with Vav proteins. A, histograms of FRET signals showing an interaction of c-Cbl and Vav in HL-60 and NB4 cells. B, the FRET signals between c-Cbl and Vav for control and RA-treated (24 h) HL-60 cells. Bars represent means ± S.E. of 3 repeats. The different letters indicate significant differences from cells stained with donor or acceptor and both secondary antibodies. C, immunoprecipitation confirms the binding between Cbl and Vav in both HL-60 and NB4 cells that were untreated (C) or RA treated (24 h). Co-IP using anti-c-Cbl or anti-Vav antibody pulled down c-Cbl or Vav from protein lysates of WT-HL60 and NB4 that were Western blotted (WB) using anti-Vav or anti-c-Cbl. No signal was detected in a negative control. Western blots of total protein lysates show the expression levels of Vav or c-Cbl in untreated or RA-treated HL-60 or NB4 cells. Anti-GAPDH was used to show consistently the input of total cellular proteins in the co-IP reactions. D, c-Cbl was immunoprecipitated from protein lysates of vector control, WT c-Cbl, and mutant G306E and C381A transfectants and co-immunoprecipitated Vav detected in Western blots. Total cell lysates from these cells were also Western blotted for Vav to check Vav expression.
FIGURE 8.
FIGURE 8.
The interaction of c-Cbl G306E and C381A mutants with Slp76. A, immunoprecipitation of c-Cbl and Western blots of Slp76 in vector control, WT c-Cbl, G306E, and C381A stable transfectants. No signal was detected in a negative control using nonspecific immunoglobulin. B, histograms of FRET signals showing no c-Cbl and Slp76 FRET signal in HL-60 cells. C, Slp76 protein was co-immunoprecipitated with c-Cbl in untreated or (24 h) RA-treated HL-60 and NB4 cells. Proteins immunoprecipitated with c-Cbl from protein lysates of HL60 and NB4 were Western blotted using anti-Slp76 (top) antibody. Nonspecific immunoglobulin was used as a negative control, and no signal was detected. Western blots (WB) of total protein lysates using anti-Slp76 (middle panel) and anti-GAPDH (lower panel) were used to show Slp76 expression levels and consistency of input of total cellular proteins in the co-IP reactions. D, Slp76 protein was co-immunoprecipitated with Vav in untreated or (24 h) RA-treated HL-60 and NB4 cells (top). Slp76 expression and consistency of input of total proteins in the co-IP reactions are shown in the middle and lower panels. To better show Slp76 expression levels, the exposure is darker than that in A.

Similar articles

Cited by

References

    1. Yen A., Roberson M. S., Varvayanis S., Lee A. T. (1998) Cancer Res. 58, 3163–3172 - PubMed
    1. Yen A., Roberson M. S., Varvayanis S. (1999) In Vitro Cell Dev. Biol. 35, 527–532 - PubMed
    1. Mann G., Reinhardt D., Ritter J., Hermann J., Schmitt K., Gadner H., Creutzig U. (2001) Ann. Hematol. 80, 417–422 - PubMed
    1. Collins S. J., Gallo R. C., Gallagher R. E. (1977) Nature 270, 347–349 - PubMed
    1. Breitman T. R., Selonick S. E., Collins S. J. (1980) Proc. Natl. Acad. Sci. U.S.A. 77, 2936–2940 - PMC - PubMed

Publication types

MeSH terms