. 2009 Sep 25;284(39):26578-90.
doi: 10.1074/jbc.M109.011775. Epub 2009 Jul 27.

Phosphoenolpyruvate cycling via mitochondrial phosphoenolpyruvate carboxykinase links anaplerosis and mitochondrial GTP with insulin secretion

Affiliations

Phosphoenolpyruvate cycling via mitochondrial phosphoenolpyruvate carboxykinase links anaplerosis and mitochondrial GTP with insulin secretion

Romana Stark et al. J Biol Chem. .

Abstract

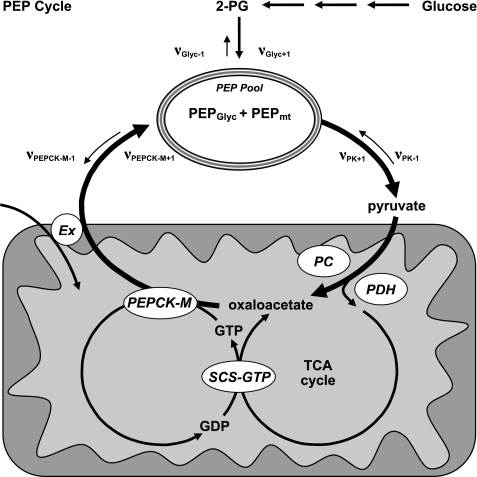
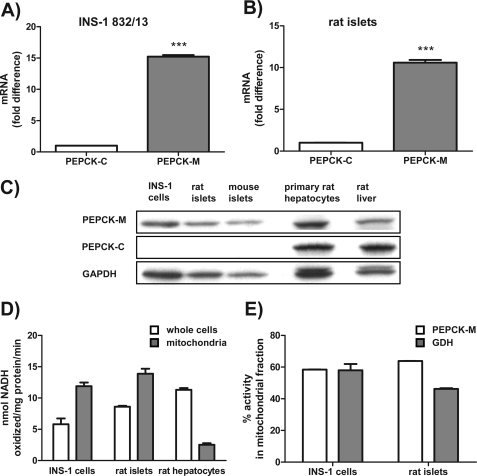
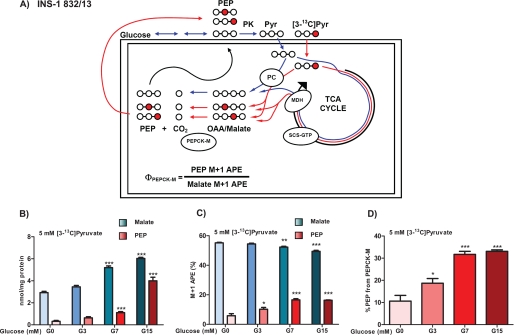
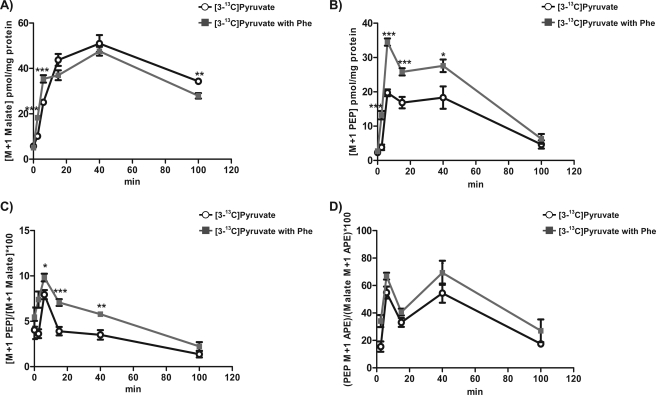
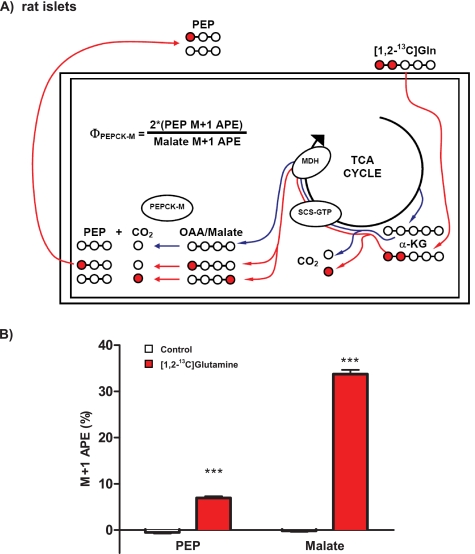
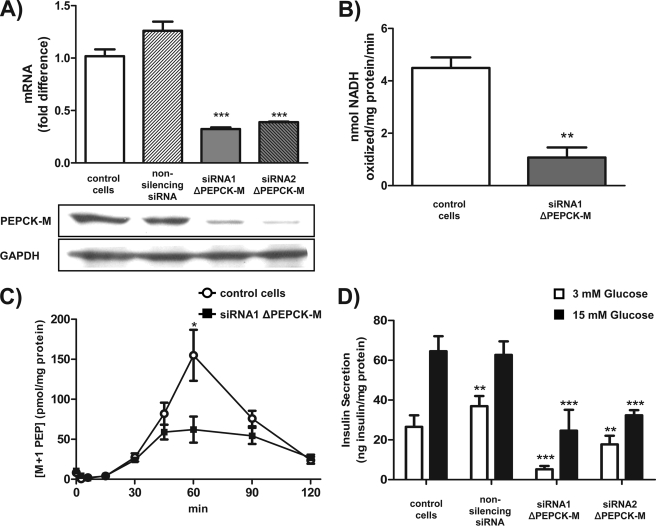
Pancreatic beta-cells couple the oxidation of glucose to the secretion of insulin. Apart from the canonical K(ATP)-dependent glucose-stimulated insulin secretion (GSIS), there are important K(ATP)-independent mechanisms involving both anaplerosis and mitochondrial GTP (mtGTP). How mtGTP that is trapped within the mitochondrial matrix regulates the cytosolic calcium increases that drive GSIS remains a mystery. Here we have investigated whether the mitochondrial isoform of phosphoenolpyruvate carboxykinase (PEPCK-M) is the GTPase linking hydrolysis of mtGTP made by succinyl-CoA synthetase (SCS-GTP) to an anaplerotic pathway producing phosphoenolpyruvate (PEP). Although cytosolic PEPCK (PEPCK-C) is absent, PEPCK-M message and protein were detected in INS-1 832/13 cells, rat islets, and mouse islets. PEPCK enzymatic activity is half that of primary hepatocytes and is localized exclusively to the mitochondria. Novel (13)C-labeling strategies in INS-1 832/13 cells and islets measured substantial contribution of PEPCK-M to the synthesis of PEP. As high as 30% of PEP in INS-1 832/13 cells and 41% of PEP in rat islets came from PEPCK-M. The contribution of PEPCK-M to overall PEP synthesis more than tripled with glucose stimulation. Silencing the PEPCK-M gene completely inhibited GSIS underscoring its central role in mitochondrial metabolism-mediated insulin secretion. Given that mtGTP synthesized by SCS-GTP is an indicator of TCA flux that is crucial for GSIS, PEPCK-M is a strong candidate to link mtGTP synthesis with insulin release through anaplerotic PEP cycling.


Figures

FIGURE 1.
FIGURE 1.
PEP cycle. PEP is produced during glycolysis and is further metabolized to pyruvate by PK. Pyruvate that enters the TCA cycle by pyruvate dehydrogenase will generate GTP via direct synthesis by SCS-GTP. Anaplerotic pyruvate entry by PC will generate oxaloacetate. PEPCK-M will then consume oxaloacetate and GTP to produce PEP, GDP, and CO2. PEP is then transported out of the mitochondrial matrix by an anion transporter (Ex) in exchange for another metabolite depending on the transporter. Mitochondrial PEP, thus, contributes to the PEP pool that is determined by the rate of appearance (νPEPCK-M+1+ νGlyc+1) of PEP minus the rate of disappearance (νPK+1). One turn of the PEP cycle will result in the net exchange of one ion into the mitochondrial matrix. Unidirectional fluxes are indicated by ν followed by the enzyme with the forward direction being +1 and the reverse −1. GDP in turn can be reused by SCS-GTP. PDH, pyruvate dehydrogenase.
FIGURE 2.
FIGURE 2.
PEPCK-M but not PEPCK-C is present in INS-1 832/13 cells, rat islets, and mouse islets. A and B, PEPCK-M mRNA expression in comparison to PEPCK-C mRNA expression by quantitative PCR in INS-1 832/13 cells (A) and rat islets (B). C, Western blots using an antibody specific for PEPCK-C and a peptide antibody specific for PEPCK-M in INS-1 832/13 cells, rat, and mouse islets. D, PEPCK activity in whole cells as well as isolated mitochondria of INS-1 832/13 cells, rat islets, and hepatocytes using a traditional method measuring NADH oxidation. E, PEPCK activity in the mitochondrial fraction of INS-1 832/13 cells and rat islets compared with glutamate dehydrogenase (GDH) activity. Error bars are S.E. and significance by t test; ***, p < 0.001.
FIGURE 3.
FIGURE 3.
Mitochondrial PEPCK makes PEP in INS-1 832/13 cells. A, schematic of PEP labeling strategy. Glucose is metabolized via glycolysis to PEP and then to pyruvate (Pyr) by PK before mitochondrial uptake where it is metabolized by the TCA cycle producing OAA via malate dehydrogenase (MDH) or by PC directly to OAA. Unlabeled glucose or pyruvate will produce malate and PEP that has only natural abundance carbon in all positions (white circles and blue lines). Metabolism of [3-13C]pyruvate (red circles and lines) will label OAA equally in the 2 or 3 position regardless of pyruvate dehydrogenase (PDH) or PC metabolism. B–D, PEPCK-M flux in INS-1 832/13 cells is enhanced by glucose. INS-1 832/13 cells were preincubated in DMEM base without glucose for 45 min. Then 5 mm [3-13C]pyruvate with 0, 3, 7, or 15 mm glucose was added for 45 min before cells were quenched. B, the LC/MS/MS measured concentrations of total malate and PEP (labeled and unlabeled). C, the LC/MS/MS calculated APE of label in malate and PEP M+1 isotopologues. D, the contribution of PEPCK-M to PEP synthesis relative to glycolysis. Error bars are S.E. and significance was by ANOVA; *, p < 0.05; **, p < 0.01; ***, p < 0.001.
FIGURE 4.
FIGURE 4.
Inhibition of pyruvate kinase by phenylalanine in INS-1 832/13 cells. A–D, INS-1 832/13 cells were preincubated in DMEM base without glucose for 60 min. Then the medium was changed to DMEM base with 5 mm [3-13C]pyruvate with (gray squares) or without (black circles) 5 mm phenylalanine and quenched at the indicated times. The concentration of 13C-labeled M+1 isotopologue of malate (A) and PEP (B) with PK inhibition. C, the ratio of [PEP M+1] concentration to [Malate M+1] concentration. D, ratio of PEP M+1 APE to malate M+1 APE (ΦPEPCK-M). Error bars are S.E. and significance was by ANOVA; *, p < 0.05; **, p < 0.01; ***, p < 0.001.
FIGURE 5.
FIGURE 5.
Mitochondrial PEPCK makes PEP in intact rat islets. A, schematic of PEP labeling strategy for islets. [1,2-13C]Glutamine (red circles and lines) is transported into the islet and deaminated to α-KG and then metabolized to succinyl-CoA loosing the label in carbon 1 to CO2. Racemization across SCS and fumarase will evenly split the 13C label between carbons 1 and 4 of OAA. Thus, only half of the PEP produced by PEPCK-M will retain its label, whereas half is lost to CO2. Unlabeled glutamine will produce malate and PEP that has only natural abundance carbon in all positions (white circles and blue lines). B, PEPCK-M activity in intact rat islets using [1,2-13C]glutamine. Rat islets were preincubated in DMEM base without glucose for 45 min and then with or without 5 mm [1,2-13C]glutamine for 45 min. The 13C enrichment of the M+1 isotopologue of malate M+1 and PEP are shown. Error bars are S.E. and significance by t test and ANOVA; *, p < 0.05; **, p < 0.01; ***, p < 0.001.
FIGURE 6.
FIGURE 6.
PEPCK-M is required for PEP synthesis and insulin secretion. A, two different siRNAs were used to silence PEPCK-M expression in INS-1 832/13 cells. -Fold change in PEPCK-M mRNA levels after 36 h of transfection with a control siRNA (non-silencing siRNA), siRNA1, or siRNA2 against PEPCK-M normalized to GAPDH. Western blot analysis of PEPCK-M after knockdown using siRNA in INS-1 832/13 cells is shown below. B, PEPCK activity measurement in INS-1 832/13 cells after silencing of PEPCK-M with siRNA1 compared with non-treated cells. C, time course of M+1 labeled PEP by PEPCK-M. INS-1 832/13 cells were preincubated in DMEM base without glucose for 60 min and then 15 mm glucose with 5 mm [3-13C]pyruvate. Shown are the concentrations of the M+1 isotopologue of PEP metabolized by PEPCK-M in non-transfected and siRNA1-transfected cells at the indicated times. D, glucose-stimulated insulin secretion in INS-1 832/13 cells that were non-transfected or transfected with a control siRNA, siRNA1, or siRNA2 against PEPCK-M. Cells were preincubated in KRBH with 3 mm glucose for 90 min and then with either 3 or 15 mm glucose for 90 min. Error bars are S.E. and significance by t test and ANOVA; *, p < 0.05; **, p < 0.01; ***, p < 0.001.

References

    1. Newgard C. B., Lu D., Jensen M. V., Schissler J., Boucher A., Burgess S., Sherry A. D. (2002) Diabetes 51, S389–393 - PubMed
    1. Lu D., Mulder H., Zhao P., Burgess S. C., Jensen M. V., Kamzolova S., Newgard C. B., Sherry A. D. (2002) Proc. Natl. Acad. Sci. U.S.A. 99, 2708–2713 - PMC - PubMed
    1. Pongratz R. L., Kibbey R. G., Shulman G. I., Cline G. W. (2007) J. Biol. Chem. 282, 200–207 - PubMed
    1. Cline G. W., Lepine R. L., Papas K. K., Kibbey R. G., Shulman G. I. (2004) J. Biol. Chem. 279, 44370–44375 - PubMed
    1. Kibbey R. G., Pongratz R. L., Romanelli A. J., Wollheim C. B., Cline G. W., Shulman G. I. (2007) Cell Metab. 5, 253–264 - PMC - PubMed

Publication types

MeSH terms