. 2009 Sep 25;284(39):26860-70.
doi: 10.1074/jbc.M109.037507. Epub 2009 Jul 27.

Galectin-1 co-clusters CD43/CD45 on dendritic cells and induces cell activation and migration through Syk and protein kinase C signaling

Affiliations

Galectin-1 co-clusters CD43/CD45 on dendritic cells and induces cell activation and migration through Syk and protein kinase C signaling

Jennifer A Fulcher et al. J Biol Chem. .

Abstract

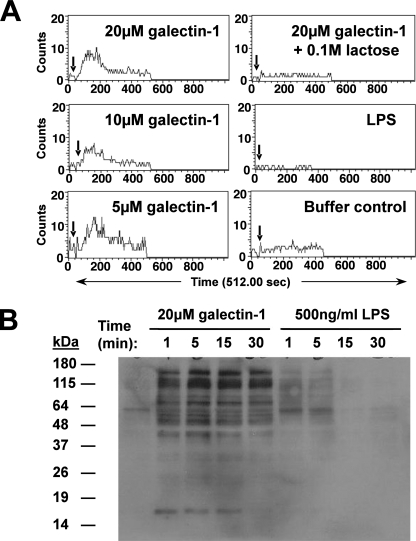
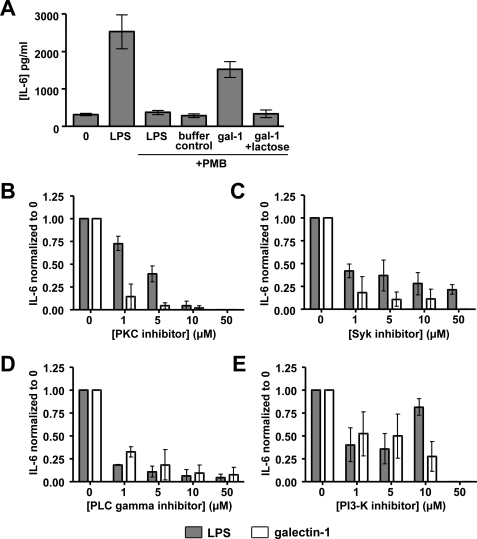
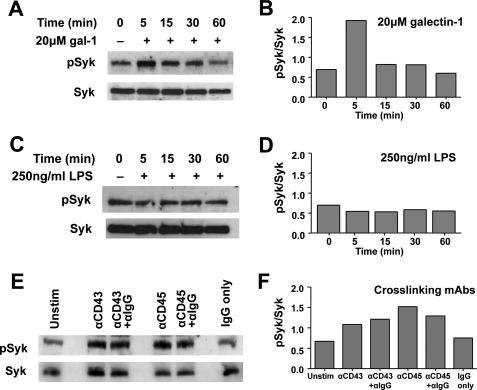
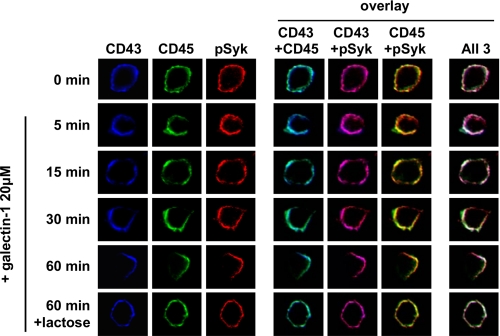
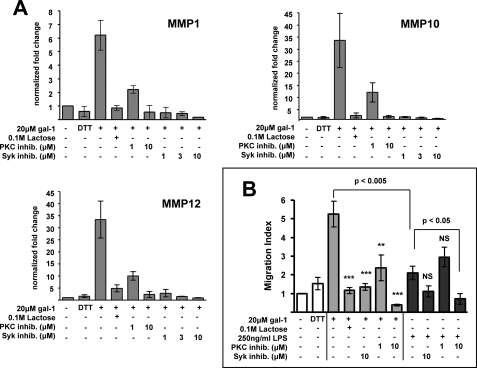
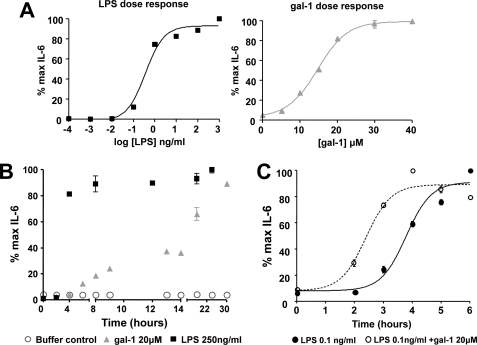
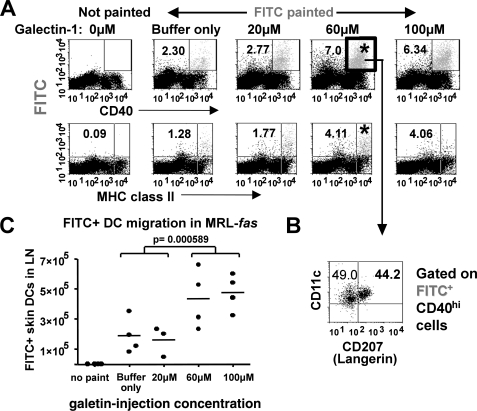
Galectin-1 is a galactoside-binding lectin expressed in multiple tissues that has pleiotropic immunomodulatory functions. We previously showed that galectin-1 activates human monocyte-derived dendritic cells (MDDCs) and triggers a specific genetic program that up-regulates DC migration through the extracellular matrix, an integral property of mucosal DCs. Here, we identify the galectin-1 receptors on MDDCs and immediate downstream effectors of galectin-1-induced MDDC activation and migration. Galectin-1 binding to surface CD43 and CD45 on MDDCs induced an unusual unipolar co-clustering of these receptors and activates a dose-dependent calcium flux that is abrogated by lactose. Using a kinome screen and a systems biology approach, we identified Syk and protein kinase C tyrosine kinases as mediators of the DC activation effects of galectin-1. Galectin-1, but not lipopolysaccharide, stimulated Syk phosphorylation and recruitment of phosphorylated Syk to the CD43 and CD45 co-cluster on MDDCs. Inhibitors of Syk and protein kinase C signaling abrogated galectin-1-induced DC activation as monitored by interleukin-6 production; and MMP-1, -10, and -12 gene up-regulation; and enhanced migration through the extracellular matrix. The latter two are specific features of galectin-1-activated DCs. Interestingly, we also found that galectin-1 can prime DCs to respond more quickly to low dose lipopolysaccharide stimulation. Finally, we underscore the biological relevance of galectin-1-enhanced DC migration by showing that intradermal injection of galectin-1 in MRL-fas mice, which have a defect in skin DC emigration, increased the in vivo migration of dermal DCs to draining lymph nodes.


Figures

FIGURE 1.
FIGURE 1.
Galectin-1 specifically binds to CD43 and CD45 and co-cluster these glycoconjugates on human MDDC surface. A, MDDCs were cell surface biotinylated and then incubated with 20 μm of galectin-1, as described under “Experimental Procedures.” After cross-linking with cell-impermeant reversible cross-linker, anti-galectin-1 serum was used to immunoprecipitate (IP) galectin-1 and any bound cell surface receptors. Western blotting (WB) with streptavidin-horseradish peroxidase revealed putative galectin-1 counter receptors on MDDC surfaces. Note that band 1 and band 2 correspond to CD45 and CD43 identified as indicated below. B, CD45 and CD43 were identified as specific receptors in the co-immunoprecipitate by Western blotting with specific anti-CD45 or -CD43 antibodies (lanes 3 and 7, respectively). Galectin-1 binding to CD43 and CD45 was carbohydrate-dependent because it could be competed off with 0.1 m lactose (lanes 4 and 8). Note that the endogenous amount of galectin-1 produced by DCs was sufficient to mediate co-immunoprecipitation of CD45 (lanes 1 and 2) but not CD43 (lanes 5 and 6). C and E, MDDCs grown on polylysine-coated coverslips were exposed to galectin-1 (at indicated concentrations) for 1 h at 37 °C. The cells were then fixed and processed for confocal microscopy as detailed under “Experimental Procedures” using antibodies against CD43, CD45, and CCR5. 60× images are shown. D, the graph indicates the percentage of cells with CD43 and CD45 clustering (250 cells counted per condition). The buffer-, LPS-, and lactose-treated MDDCs served as additional specificity controls. Note that CD43 and CD45 co-clustering occurred in >50% of cells only above 10 μm concentration of galectin-1.
FIGURE 2.
FIGURE 2.
Galectin-1 induces calcium flux and differential tyrosine-phosphorylation patterns in MDDCs. A, immature MDDCs were loaded with Indo-1AM (3 μm) + 0.02% pluronic and then stimulated with galectin-1 at indicated times (↓) during acquisition on a BD LSR flow cytometer. The data are shown as numbers of cells with calcium bound Indo-1/unbound Indo-1 (FL5/FL4) ratio above base line versus time. B, MDDCs were treated with galectin-1 (20 μm) or LPS (500 ng/ml) for the indicated times and then lysed, and equivalent amounts of cell lysate (30 μg/lane) were Western blotted using the 4G10 monoclonal anti-phosphotyrosine antibody. Galectin-1 was added to cells in the presence of polymyxin B (10 μg/ml) to eliminate any confounding effects of endotoxin contamination.
FIGURE 3.
FIGURE 3.
Syk and PKC have significant roles in galectin-1-induced cytokine secretion from MDDCs. A, MDDCs were treated with LPS (250 ng/ml), buffer control (80 μm DTT), or galectin-1 (20 μm). 10 μg/ml of polymyxin B (PMB) and 0.1 m lactose were added 30 min prior to stimulation where indicated. Our galectin-1 stocks had minimal LPS contamination of 1–4 endotoxin units/ml as measured by the Limulus amebocyte lysate assay. 250 ng/ml of the LPS stock used had 750 endotoxin units/ml. Clearly, 10 μg/ml of polymyxin B was more than sufficient to eliminate any confounding effects of endotoxin contamination. B–E, MDDCs were preincubated with specific PTK inhibitors for PKC (bisindolylmaleimide I) (B), Syk (Calbiochem 574711) (C), PLCγ (U73122) (D), and PI3K (LY294002) (E) for 2 h prior to galectin-1 (20 μm) or LPS (250 ng/ml) stimulation. At 24 h, IL-6 secretion in the supernatant was assayed by ELISA. The data are shown as IL-6 levels normalized to the no inhibitor condition (0 μm) ± S.E. of five independent experiments in at least four human donors.
FIGURE 4.
FIGURE 4.
Galectin-1 induces increased Syk phosphorylation in human MDDCs. Western blots showing pSyk and total Syk protein in MDDC lysate (30 μg/lane) following treatment with galectin-1 (20 μm) (A) or LPS (250 ng/ml) (C) for the indicated times or 1 μg of mouse anti-CD43 monoclonal antibody or anti-CD45 monoclonal antibody (E) for 1 h. Where indicated, anti-mouse IgG was added during the last 30 min of incubation to super-cross-link the mouse monoclonal antibodies. Corresponding densitometric quantification of the pSyk/total Syk ratios is shown in B, D, and F, respectively. Galectin-1 was added to cells in the presence of polymyxin B (10 μg/ml) to eliminate any contaminating endotoxin effects.
FIGURE 5.
FIGURE 5.
Galectin-1 stimulates redistribution of pSyk to co-localize with the CD43 and CD45 co-cluster on MDDCs. Confocal microscopy was performed on MDDCs treated with galectin-1 (20 μm) and prepared as in Fig. 1B except that the samples were processed at the indicated time points. In addition, intracellular staining for pSyk was performed in conjunction with anti-CD43 and anti-CD45 as described under “Experimental Procedures.” 60× images are shown. Fluorochromes were chosen for each antibody that minimized bleed-through for each of the filters used (Alexa 594 for anti-pSyk, Alexa 633 for anti-CD43, and Alexa 488 for anti-CD45). The Images are false-colored to represent CD43 (blue), CD45 (green), and pSyk (red). Note the co-localization of pSyk with CD43 and CD45 on the MDDC surface and their progressive unipolar clustering after galectin-1 binding. Treatment with 0.1 m lactose, a competitive inhibitor of galectin-1 binding, prevented the progressive co-clustering seen at 60 min. Blue (CD43) + green (CD45) = cyan; blue (CD43) + red (pSyk) = magenta; green (CD45) + red (pSyk) = yellow. Co-localization of all three primary colors is shown in white. Representative cells from each time point are shown (at least 100 cells were captured at each time point).
FIGURE 6.
FIGURE 6.
Syk and PKC are critical for galectin-1-induced MMP gene expression and enhanced migration through the extracellular matrix. A, MMP gene expression was quantified by real time quantitative RT-PCR at 18 h following galectin-1 (20 μm) stimulation in the presence or absence of the indicated concentrations of Syk inhibitor (Calbiochem 574711), PKC inhibitor (bisindolylmaleimide I), or 0.1 m lactose. DTT refers to buffer control (80 μm DTT + 10 μg/ml polymyxin B). mRNA expression of each gene is normalized to the housekeeping gene β-actin. The data are shown as fold changes of normalized mRNA expression relative to the untreated condition. The graphs depict the means ± S.E. of three independent human donors. B, migration of MDDCs treated with 250 ng/ml LPS (black bars), 20 μm galectin-1 (gray bars), or DTT buffer control in the presence or absence of Syk inhibitor (10 μm), PKC inhibitor (1 or 10 μm) or 0.1 m lactose was measured using transwell assays with Matrigel-coated inserts (8.0-μm pore). The bottom chamber contained 200 ng/ml CCL19 (MIP-3β), which served as the chemoattractant. Each experiment consisted of at least two independent counts by different individuals, one blinded to the sample identity (see “Experimental Procedures”). The data are normalized as relative migration compared with immature DCs in which the average from all counts in each experiment is set at 1.0 (7). The data are shown as the means ± S.E. of four independent human donors. Significance was determined by two-tailed unpaired Student's t test. **, p < 0.005; ***, p < 0.0005 compared with galectin-1 stimulation alone. NS, not significant compared with LPS stimulation alone.
FIGURE 7.
FIGURE 7.
Galectin-1 enhances the inflammatory response of MDDCs to LPS. A, MDDCs were stimulated with increasing doses of LPS (10−4 to 103 ng/ml) or galectin-1 (0–40 μm). Supernatants were collected at 24 h, and IL-6 was measured by ELISA. Cells treated with galectin-1 were preincubated with polymyxin B (10 μg/ml) for 30 min to eliminate any contaminating endotoxin effects. B, MDDCs were treated with 250 ng/ml LPS (black squares), 20 μm galectin-1 (gray triangles), or buffer control (80 μm DTT + 10 μg/ml polymyxin B) (open circles), and IL-6 secretion was measured by ELISA of the culture supernatants at the indicated time points. The data are represented as percentages of maximal IL-6 production. C, MDDCs were stimulated with LPS (0.1 ng/ml) alone or were preincubated with galectin-1 (20 μm) for 8 h prior to LPS stimulation. Supernatant was collected after the indicated time periods, and IL-6 was measured by ELISA. The data are presented as percentages of maximal IL-6 secretion. The time to 50% maximal response is 3.8 h for LPS treatment alone (filled circle, solid line) and 2.5 h for LPS and galection-1 co-stimulus (open circle, dotted line) (p < 0.0001, two-way analysis of variance). Galectin-1 was preincubated with polymyxin B-agarose beads for 30 min to eliminate endotoxin contamination from the galectin-1 preparations.
FIGURE 8.
FIGURE 8.
Galectin-1 promotes the migration of skin DCs to regional lymph nodes in vivo. MRL-fas mice were intradermally injected with a single 10-μl bolus of 80 μm DTT buffer control or the indicated concentrations of galectin-1 (20 μm = 2.8 μg, 60 μm = 8.4 μg, and 100 μm = 14 μg) preincubated with 10 μg/ml polymyxin B and then painted with 25 μl of a FITC solution at the dorsum of the ear 24 h post-injection, as described under “Experimental Procedures.” A, representative dot plots of single cell suspensions of cervical lymph nodes harvested at 48 h post-FITC painting. Gated FSChiSSChi cells were analyzed for FITC and CD40 or major histocompatibility complex class II to identify putative skin DC emigrants. B, gated FITC+CD40+ cells were further analyzed for CD207 (Langerin) and CD11c. C, absolute numbers of migrant skin DCs (FITC+CD11c+CD40hi) in draining lymph nodes are shown from each mouse (n = 4/group). Galectin-1 significantly enhanced the trafficking of skin emigrants to draining lymph nodes (p < 0.0005, one-way analysis of variance for all groups; p = 0.00576 between the 0–20 μm groups and the 60–100 μm groups; unpaired Student's t test).

Similar articles

Cited by

References

    1. Banchereau J., Briere F., Caux C., Davoust J., Lebecque S., Liu Y. J., Pulendran B., Palucka K. (2000) Annu Rev. Immunol. 18, 767–811 - PubMed
    1. Banchereau J., Steinman R. M. (1998) Nature 392, 245–252 - PubMed
    1. Akira S., Takeda K. (2004) Nat. Rev. Immunol. 4, 499–511 - PubMed
    1. Iwasaki A., Medzhitov R. (2004) Nat. Immunol. 5, 987–995 - PubMed
    1. Gallucci S., Matzinger P. (2001) Curr. Opin. Immunol. 13, 114–119 - PubMed

Publication types

MeSH terms