

OsTGAP1, a bZIP transcription factor, coordinately regulates the inductive production of diterpenoid phytoalexins in rice
- PMID: 19635799
- PMCID: PMC2785339
- DOI: 10.1074/jbc.M109.036871
OsTGAP1, a bZIP transcription factor, coordinately regulates the inductive production of diterpenoid phytoalexins in rice
Abstract
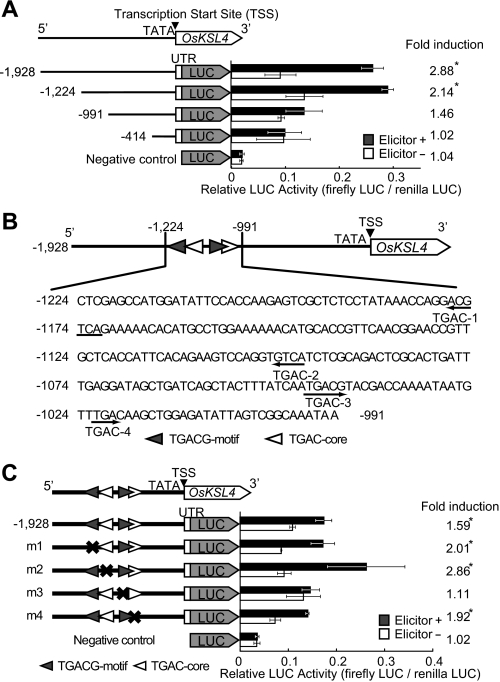
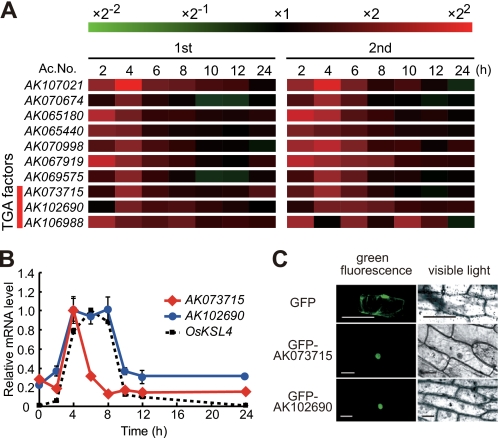
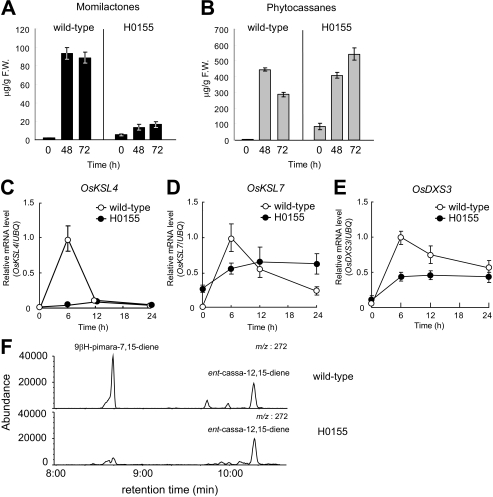
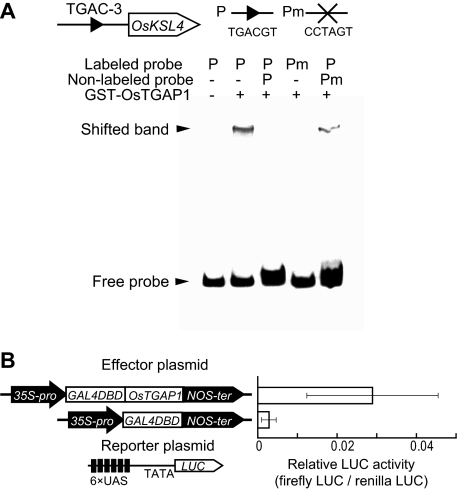
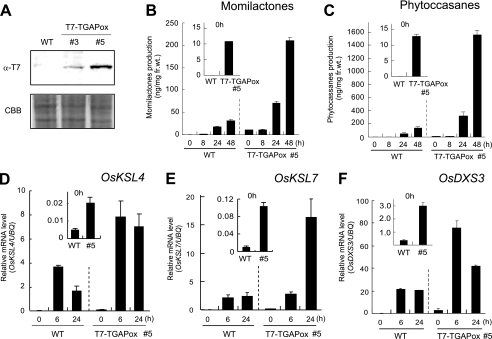
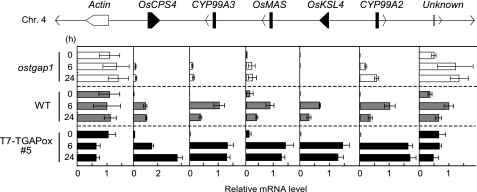
Production of major diterpenoid phytoalexins, momilactones and phytocassanes, is induced in rice upon recognition of pathogenic invasion as plant defense-related compounds. We recently showed that biosynthetic genes for momilactones are clustered on rice chromosome 4 and co-expressed after elicitation, mimicking pathogen attack. Because genes for most metabolic pathways in plants are not organized in gene clusters, examination of the mechanism(s) regulating the expression of such clustered genes is needed. Here, we report a chitin oligosaccharide elicitor-inducible basic leucine zipper transcription factor, OsTGAP1, which is essential for momilactone biosynthesis and regulates the expression of the five genes in the cluster. The knock-out mutant for OsTGAP1 had almost no expression of the five clustered genes (OsCPS4, OsKSL4, CYP99A2, CYP99A3, and OsMAS) or production of momilactones upon elicitor treatment. Inductive expression of OsKSL7 for phytocassane biosynthesis was also largely affected in the ostgap1 mutant, although phytocassane accumulation still occurred. Conversely, OsTGAP1-overexpressing lines exhibited enhanced expression of the clustered genes and hyperaccumulation of momilactones in response to the elicitor. Furthermore, enhanced expression of OsKSL7 and hyperaccumulation of phytocassanes was also observed. We also found that OsTGAP1 overexpression can influence transcriptional up-regulation of OsDXS3 in the methylerythritol phosphate pathway, eventually leading to inductive production of diterpenoid phytoalexins. These results indicate that OsTGAP1 functions as a key regulator of the coordinated transcription of genes involved in inductive diterpenoid phytoalexin production in rice and mainly exerts an essential role on expression of the clustered genes for momilactone biosynthesis.
Figures

Similar articles
-
Identification of target genes of the bZIP transcription factor OsTGAP1, whose overexpression causes elicitor-induced hyperaccumulation of diterpenoid phytoalexins in rice cells.PLoS One. 2014 Aug 26;9(8):e105823. doi: 10.1371/journal.pone.0105823. eCollection 2014. PLoS One. 2014. PMID: 25157897 Free PMC article.
-
Overexpression of the bZIP transcription factor OsbZIP79 suppresses the production of diterpenoid phytoalexin in rice cells.J Plant Physiol. 2015 Jan 15;173:19-27. doi: 10.1016/j.jplph.2014.09.001. Epub 2014 Sep 16. J Plant Physiol. 2015. PMID: 25462074
-
OsTGAP1 is responsible for JA-inducible diterpenoid phytoalexin biosynthesis in rice roots with biological impacts on allelopathic interaction.Physiol Plant. 2017 Dec;161(4):532-544. doi: 10.1111/ppl.12638. Epub 2017 Oct 26. Physiol Plant. 2017. PMID: 28857222
-
The biosynthesis of isoprenoids and the mechanisms regulating it in plants.Biosci Biotechnol Biochem. 2011;75(7):1219-25. doi: 10.1271/bbb.110228. Epub 2011 Jul 7. Biosci Biotechnol Biochem. 2011. PMID: 21737944 Review.
-
Biosynthesis, elicitation and roles of monocot terpenoid phytoalexins.Plant J. 2014 Aug;79(4):659-78. doi: 10.1111/tpj.12436. Epub 2014 Mar 26. Plant J. 2014. PMID: 24450747 Review.
Cited by
-
Interaction of bZIP transcription factor TGA6 with salicylic acid signaling modulates artemisinin biosynthesis in Artemisia annua.J Exp Bot. 2019 Aug 7;70(15):3969-3979. doi: 10.1093/jxb/erz166. J Exp Bot. 2019. PMID: 31120500 Free PMC article.
-
Genome-Wide Identification and Expression Analysis of ent-kaurene synthase-like Gene Family Associated with Abiotic Stress in Rice.Int J Mol Sci. 2024 May 18;25(10):5513. doi: 10.3390/ijms25105513. Int J Mol Sci. 2024. PMID: 38791550 Free PMC article.
-
Gene clusters for secondary metabolic pathways: an emerging theme in plant biology.Plant Physiol. 2010 Oct;154(2):531-5. doi: 10.1104/pp.110.161315. Plant Physiol. 2010. PMID: 20921179 Free PMC article. No abstract available.
-
Prolonged expression of the BX1 signature enzyme is associated with a recombination hotspot in the benzoxazinoid gene cluster in Zea mays.J Exp Bot. 2015 Jul;66(13):3917-30. doi: 10.1093/jxb/erv192. Epub 2015 May 11. J Exp Bot. 2015. PMID: 25969552 Free PMC article.
-
Transcriptional Profiles of SmWRKY Family Genes and Their Putative Roles in the Biosynthesis of Tanshinone and Phenolic Acids in Salvia miltiorrhiza.Int J Mol Sci. 2018 May 29;19(6):1593. doi: 10.3390/ijms19061593. Int J Mol Sci. 2018. PMID: 29843472 Free PMC article.
References
-
- Koga J., Shimura M., Oshima K., Ogawa N., Yamauchi T., Ogasawara N. (1995) Tetrahedron 51, 7907–7918
-
- Koga J., Ogawa N., Yamauchi T., Kikuchi M., Ogasawara N., Shimura M. (1997) Phytochemistry 44, 249–253
-
- Yajima A., Mori K. (2000) Eur. J. Org. Chem. 24, 4079–4091
-
- Akatsuka T., Kodama O., Sekido H., Kono Y., Takeuchi S. (1985) Agric. Biol. Chem. 49, 1689–1694
Publication types
MeSH terms
Substances
LinkOut - more resources
Full Text Sources
